ADHD Statistics in US (2026)
If you have a young child who can't sit still, drifts off mid-sentence, or seems to live in a different time zone than the rest of the family, you're not alone. Attention-deficit/hyperactivity disorder (ADHD) is now diagnosed in roughly 1 in 9 American children, which works out to about 7.1 million kids.
This guide pulls together the most recent peer-reviewed statistics on ADHD for 2026, with a particular focus on K–3 children, so parents and teachers know what the numbers actually say.
A note on recency: peer-reviewed analyses of U.S. ADHD prevalence run on a delay. The most current peer-reviewed nationally representative figures come from the 2022 National Survey of Children's Health (NSCH), published in 2024. NSCH 2023 data, released through the Data Resource Center for Child and Adolescent Health, confirms that prevalence has stabilized at 2022 levels [4]. Several 2025 and 2026 systematic reviews and clinical studies add fresh perspective on trends, treatment, and global context, and we draw on all of them below.
TL;DR: ADHD in 2026 at a Glance
11.4% of U.S. children aged 3–17 (~7.1 million) have ever been diagnosed with ADHD; 10.5% (~6.5 million) currently have it [1].
NSCH 2023 data confirms the rate has stabilized at 10.5% currently affected (~6.4 million children) - no continued upward trend after the 2022 jump [4].
Diagnosed prevalence has roughly doubled since 1997 (6.1% → 11.4%), but recent 2025–2026 peer-reviewed reviews suggest true prevalence has been relatively stable for decades - the rise reflects awareness, not biology [3][13][20].
Boys (14.7%) are diagnosed at nearly twice the rate of girls (8.1%), but the gap is narrowing as we get better at recognizing ADHD in girls [1].
77.9% of children with ADHD have at least one co-occurring condition - most often anxiety, behavior problems, or a learning disability [1].
30.1% of U.S. children with current ADHD received no treatment at all in 2022, up from 23% in 2016 [1].
Stimulant dispensing to U.S. children fell by ~19% in early 2020, then partially recovered; the 2022–2023 Adderall shortage prompted many children to switch to alternative stimulants rather than reducing treatment [9].
Globally, child and adolescent ADHD prevalence sits at 5–8% — meaningfully lower than U.S. parent-reported rates [11][12].
Key ADHD Statistics for 2026
What Is ADHD?
ADHD (attention-deficit/hyperactivity disorder) is a neurodevelopmental condition that affects how the brain regulates attention, activity level, and impulse control. The DSM-5-TR recognizes three "presentations":
Predominantly inattentive - trouble focusing, easily distracted, forgetful; this is the most common presentation in the general population, and is especially common in girls [13].
Predominantly hyperactive-impulsive - fidgeting, blurting out, struggling to wait; more often spotted in young boys.
Combined presentation - both sets of symptoms; this is the presentation most likely to be referred for clinical services [13].
Symptoms must appear before age 12, persist for at least six months, and meaningfully interfere with daily life at home, at school, or in friendships. The ICD-11 used by most of the world uses very similar criteria, though small differences in case-finding mean cross-country comparisons can be tricky [15].
How Common Is ADHD in U.S. Children?
The most recent peer-reviewed analysis of the 2022 National Survey of Children's Health - published in the Journal of Clinical Child & Adolescent Psychology - found that 11.4% of U.S. children aged 3–17 have ever been diagnosed with ADHD, and 10.5% currently have it [1]. That's approximately 1 in 9 American kids, or 7.1 million children.
Newer NSCH 2023 data, released through the Child and Adolescent Health Measurement Initiative's data query system, shows that 10.5% of U.S. children aged 3–17 currently have ADHD — about 6.4 million children, essentially identical to the 2022 figure [4]. After the 2016 → 2022 jump (9.4% → 11.4% ever-diagnosed), the picture appears to have stabilized at this new, higher baseline.
A separate analysis of the National Health Interview Survey for 2017–2022, published in JAMA Network Open, found weighted prevalence held statistically steady at roughly 10.0–10.5% across those six years [2]. The two surveys use different methods, so the 10.5–11.4% range gives the most honest picture.
ADHD in K–3 Children Specifically
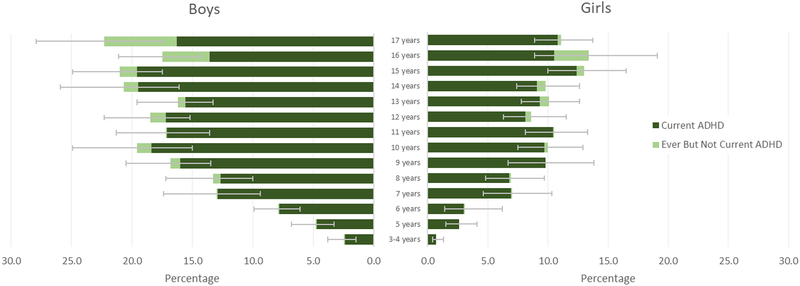
For families of younger kids, the numbers shift sharply by age:
Ages 3–5 (preschool/kindergarten): about 2.4% of children, roughly 274,000 kids nationally [1].
Ages 6–11 (most of elementary school): about 11.5% [1].
Ages 12–17 (middle/high school): about 15.5% [1].
The median age at diagnosis is 6 years — right around first grade. Children with severe ADHD are typically diagnosed around age 4, while those with milder presentations are often diagnosed closer to age 7 [10]. That makes K–3 the single most common window for an ADHD diagnosis to enter a family's life.
If your child has just been diagnosed and you're wondering what to do next, our guide on how to motivate an ADHD child with strategies that actually work is a good starting point.
Who Gets Diagnosed? Sex, Race, and Income
Boys vs. Girls
Boys are diagnosed with ADHD at roughly 1.8 times the rate of girls — 14.7% of U.S. boys vs. 8.1% of U.S. girls aged 3–17 [1]. The historical sex ratio was over 2:1, and the recent narrowing reflects improved recognition of how ADHD shows up in girls, who more often present with inattentive symptoms that don't disrupt classrooms in obvious ways. The newest 2026 systematic review in Molecular Psychiatry, covering 653,558 pediatric and 43,311 adult participants across 311 studies, reports a current pediatric clinical male-to-female ratio of about 1.9:1 — narrowing to 1.2:1 in adult clinical samples, where girls and women who were missed in childhood are increasingly being identified [16].
Peer-reviewed research on this group has flagged that girls and women with ADHD have been substantially underdiagnosed for decades [17].
Race and Ethnicity
Prevalence varies meaningfully across racial and ethnic groups in the U.S. [1]:
White non-Hispanic children: 11.9%
Black non-Hispanic children: 11.7%
American Indian/Alaska Native children: 10.3%
Hispanic/Latino children: 9.5%
Asian children: 4.0%
Children in households where English isn't the primary language: 5.4%, versus 12.5% in English-primary households
A peer-reviewed commentary in the same journal noted that these gaps likely reflect under-diagnosis driven by language access, cultural framing of behavior, and healthcare-access factors — not lower biological prevalence [8].
Income and Geography
Diagnosed prevalence is higher in lower-income families, in rural areas (12.9%), and in the U.S. South (13.5%) — and lower in the West (8.6%) and in urban areas (10.1%) [1][6].
State-by-State Variation
Diagnosed ADHD rates vary dramatically by U.S. state — from a low of about 6.1% of children in some states to a high of about 16.3% in others [6]. Among children with current ADHD, medication use ranges from 37.8% to 81.4% depending on the state, and behavior therapy ranges from 38.8% to 61.8% [6]. Southern states generally cluster at the high end of both diagnosis and treatment rates; Western states at the low end.
Are ADHD Diagnoses Going Up?
Short answer: the long arc says yes, but the most recent peer-reviewed evidence says the trend has flattened — and may have always reflected awareness more than biology.
From the late 1990s to 2016, U.S. parent-reported ADHD prevalence climbed from 6.1% to 10.2% [3]. The 2022 NSCH then showed another jump to 11.4% ever-diagnosed — roughly one million additional children diagnosed compared to 2016 [1]. NSCH 2023 data shows essentially no further change — 10.5% currently have ADHD, the same as 2022 [4]. NHIS data for 2017–2022 also found no statistically significant annual change in prevalence over that window [2].
A 2025 systematic review in the Journal of Affective Disorders concluded that the true population prevalence of childhood ADHD has been roughly stable for three decades — the rise in diagnoses reflects greater awareness, broader screening, expanded diagnostic criteria, and better access to evaluation, not a growing disease burden [20]. The newest umbrella meta-analysis, published in Molecular Psychiatry in early 2026, examined ADHD prevalence in clinical settings across 311 studies spanning 1981–2023 and detected no significant time trend in pediatric prevalence [16] — reinforcing the picture that the underlying rate has been stable while detection has improved.
What Changed After COVID-19?
The 2022 survey was the first post-pandemic snapshot of U.S. childhood ADHD, and two findings stood out [1]:
Prevalence rose from 9.4% (2016) to 11.4% (2022) — a swing attributed to pandemic-related stressors, telehealth-driven access to evaluations, and increased adult ADHD awareness rippling down to families. NSCH 2023 data confirms this new level has held [4].
The "no treatment at all" rate rose from 23.0% in 2016 to 30.1% in 2022 — meaning nearly 1 in 3 children with a current ADHD diagnosis received neither medication nor behavior therapy in the past year.
A 2025 study in Pediatrics analyzing prescription data through 2023 found that monthly stimulant dispensing to U.S. children fell by 18.8% in March 2020, then partially rebounded [9]. The widely reported October 2022 Adderall shortage didn't significantly reduce overall stimulant dispensing — instead, families and clinicians switched children from immediate-release mixed amphetamine salts to other stimulants like dexmethylphenidate to maintain treatment continuity [9]. A separate 2025 retrospective cohort study covering 2016–2023 documented a sharp post-2020 upswing in adult ADHD incidence (+15.2%), while adolescent incidence stabilized [14].
Co-Occurring Conditions: Most ADHD Kids Have Something Else Going On
For families, this is one of the most important numbers in the entire dataset: 77.9% of U.S. children with current ADHD have at least one co-occurring mental, emotional, behavioral, or developmental condition, and 51.0% have two or more [1].
The most common co-occurring conditions among children with current ADHD are:
Behavioral or conduct problems: 44.1%
Anxiety disorder: 39.1% (52.8% in girls vs. 31.7% in boys)
Learning disability: 36.5%
Developmental delay: 21.7%
Depression: 18.9% (28.6% in girls vs. 13.8% in boys)
Speech/language disorder: 14.8%
Autism spectrum disorder: 14.4%
Intellectual disability: 4.4%
For teachers of neurodiverse students, this matters enormously: ADHD is rarely "just ADHD." If a child also has a math-specific learning difference, our guide on dyscalculia vs. math anxiety walks through how to tell them apart and what to do about each.
How U.S. Children with ADHD Are Treated
Among the 6.5 million U.S. children with current ADHD [1]:
53.6% currently take ADHD medication (down from 62.0% in 2016)
44.4% received behavior therapy in the past 12 months
28.2% received both medication and behavior therapy
25.5% received medication only
16.2% received behavior therapy only
30.1% received neither (up from 23.0% in 2016)
For children under age 6, the American Academy of Pediatrics recommends parent training in behavior management as the first-line treatment before medication is considered. The data reflects this: only 23.6% of children aged 3–5 with ADHD are on medication, compared to about 57% at ages 6–11 [1]. The 2024 AAP-published systematic review of ADHD treatments in Pediatrics found behavior interventions, parent training, and stimulant medication all have substantial evidence bases, with the strongest combined effects from layering both [18].
The newest peer-reviewed prescribing data, from a February 2025 Pediatrics paper analyzing 2017–2023 dispensing patterns, confirms that overall stimulant dispensing to children has held roughly steady since the pandemic-era dip — with shifts between specific medications driven largely by supply disruptions rather than changes in clinical practice [9].
ADHD and School: IEPs, 504 Plans, and Accommodations
The most recent peer-reviewed national data on school services for children with ADHD found that 69.3% of U.S. children with current ADHD receive at least one school-based service, breaking down as [7]:
62.3% receive educational support (tutoring, preferential seating, extended time, special-ed enrollment)
42.9% have an Individualized Education Program (IEP)
32.0% receive classroom behavior management
13.6% have a 504 plan
That still leaves roughly 30% of children with ADHD receiving no school services at all, despite documented impairment [7]. Gaps are most pronounced for adolescents, non-English-speaking families, and families relying on public insurance — children with private insurance are about twice as likely to have a 504 plan in place [7]. (Note: these school-services figures come from 2014 data and remain the most current nationally representative numbers published in peer-reviewed literature.)
For teachers looking for hands-on strategies that work with K–3 ADHD learners, the concrete-representational-abstract (CRA) approach is a research-backed framework worth knowing.
Does Screen Time Cause ADHD?
This is one of the most common questions parents ask, and the peer-reviewed answer is: the relationship is correlational, not clearly causal.
A 2023 meta-analysis pooling 9 studies and over 81,000 children found that kids with two or more hours of daily screen time had roughly 1.5 times the odds of ADHD compared with peers under two hours [19]. A larger 2025 longitudinal analysis using the ABCD Study tracked nearly 12,000 children over two years and found small but significant associations between screen time and later ADHD symptoms, partly mediated through differences in brain structure development [21].
But there's a chicken-and-egg problem: children with ADHD are also drawn to screens because fast-paced digital activities engage their reward systems more reliably than slower, sustained-attention tasks.
The most defensible takeaway for parents is that excessive screen time and ADHD are linked, that limiting screen time is generally healthy, but that screens themselves aren't a confirmed "cause" of ADHD.
ADHD Around the World
Global ADHD prevalence in children and adolescents sits in the 5–8% range, according to two major peer-reviewed meta-analyses [11][12]:
A 2023 systematic review in the Italian Journal of Pediatrics pooled 61 studies and estimated 7.6% prevalence in children aged 3–12, and 5.6% in adolescents aged 12–18 [11].
A 2023 umbrella review in the Journal of Affective Disorders pooled 13 meta-analyses covering over 3.2 million children and adolescents and reached a pooled estimate of 8.0% (10% in boys, 5% in girls) [12].
The newest 2026 Molecular Psychiatry umbrella meta-analysis found significant geographic variation in pediatric clinical prevalence — highest in the Middle East (46%), North America (38%), South America (37%), and Oceania (33%), and lower in Africa and Europe [16]. The authors note that these clinical-setting differences likely reflect referral and diagnostic-practice patterns rather than true biological differences.
Country-level estimates from peer-reviewed and official sources include:
United Kingdom:NICE and the NHS estimate about 5% of children and young people have ADHD; diagnosed prevalence in UK GP records is substantially lower, indicating major under-recognition [22].
Australia: Population studies place child/adolescent ADHD prevalence at 6–10% — the most common mental health disorder among Australian children aged 4–17.
The takeaway: U.S. parent-reported ADHD rates are higher than the global average, primarily because of broader screening, more direct-to-consumer awareness, and DSM-5 criteria that capture more cases than ICD-10 [20].
Frequently Asked Questions
How many U.S. children have ADHD in 2026?
The most recent peer-reviewed analysis (using 2022 National Survey of Children's Health data) found that 11.4% of U.S. children aged 3–17 — about 7.1 million kids — have ever been diagnosed with ADHD, and 10.5% currently have it. NSCH 2023 data confirms the rate has held steady at 10.5% currently affected [1][4].
At what age is ADHD usually diagnosed?
The median age of diagnosis is 6 years old — right around first grade. Children with severe ADHD are typically diagnosed around age 4, and those with milder presentations closer to age 7 [10]. ADHD can be diagnosed reliably from age 4 onward.
Are more boys than girls diagnosed with ADHD?
Yes. 14.7% of U.S. boys versus 8.1% of girls have been diagnosed with ADHD — roughly 1.8 times as many boys [1]. That ratio is narrowing as awareness grows about how ADHD presents in girls, who more often have the inattentive form that doesn't disrupt classrooms in obvious ways [17].
Why are ADHD diagnoses going up?
Diagnosis rates have risen, but peer-reviewed research — including a 2025 systematic review in the Journal of Affective Disorders and a 2026 umbrella meta-analysis in Molecular Psychiatry — suggests the true underlying prevalence has been roughly stable for three decades or more [16][20]. The rise reflects more awareness, less stigma, broader DSM-5 criteria, expanded telehealth access (especially post-2020), and improved recognition of inattentive ADHD in girls and women.
How many children with ADHD also have another condition?
77.9% of children with current ADHD have at least one co-occurring condition, and 51% have two or more [1]. The most common are behavioral problems (44%), anxiety (39%), learning disabilities (36.5%), depression (19%), and autism (14.4%).
What percentage of children with ADHD take medication?
53.6% currently take medication, 44.4% receive behavior therapy, 28.2% receive both, and 30.1% receive neither — a number that rose from 23% in 2016 [1]. For children under age 6, the AAP recommends behavior therapy (specifically parent training) as the first-line treatment before considering medication. A February 2025 Pediatrics paper analyzing dispensing through 2023 found that the 2022 Adderall shortage didn't reduce overall stimulant use — children switched to alternative stimulants instead [9].
What's the difference between an IEP and a 504 plan for ADHD?
An IEP (Individualized Education Program) falls under the Individuals with Disabilities Education Act (IDEA) and provides specialized instruction. A 504 plan falls under Section 504 of the Rehabilitation Act and provides accommodations within the regular classroom (extra time on tests, preferential seating, etc.). About 43% of U.S. children with ADHD have an IEP, and about 14% have a 504 plan [7].
Does screen time cause ADHD?
Peer-reviewed meta-analyses find that children with two or more hours of daily screen time have about 1.5 times the odds of ADHD [19], and a 2025 longitudinal study using brain imaging found small but real associations between screen time and ADHD-symptom development [21]. But the relationship is correlational, not clearly causal — children with ADHD are also drawn to screens because of how their brains respond to fast-paced reward feedback. Limiting screen time is healthy, but screens aren't a confirmed "cause" of ADHD.
Which U.S. states have the highest ADHD rates?
Diagnosed ADHD prevalence varies from about 6.1% to 16.3% across U.S. states [6]. Southern states tend to have the highest rates; Western states the lowest.
How does ADHD in the U.S. compare to other countries?
U.S. parent-reported rates (~11%) are higher than the global average of 5–8% [11][12]. The UK estimates around 5% of children have ADHD, Australia about 6–10%. These differences mostly reflect awareness, diagnostic criteria, and healthcare-access patterns — not different biological prevalence.
When will the next round of U.S. ADHD prevalence data come out?
The 2023 NSCH data is already available through public data-query tools [4]. The next major CDC-led peer-reviewed update analyzing newer NSCH waves (2024 and beyond) is expected over the next 12–24 months, and NSCH 2025/2026 data won't be published until 2027 or later. The 2022 NSCH analysis (Danielson et al. 2024) remains the most-cited peer-reviewed snapshot.
References
[1] Danielson ML, Claussen AH, Bitsko RH, et al. (2024). ADHD Prevalence Among U.S. Children and Adolescents in 2022: Diagnosis, Severity, Co-Occurring Disorders, and Treatment. Journal of Clinical Child & Adolescent Psychology, 53(3): 343–360. https://pmc.ncbi.nlm.nih.gov/articles/PMC11334226/
[2] Li Y, Yan X, Li Q, et al. (2023). Prevalence and Trends in Diagnosed ADHD Among US Children and Adolescents, 2017–2022. JAMA Network Open, 6(10): e2336872. https://pmc.ncbi.nlm.nih.gov/articles/PMC10551769/
[3] Xu G, Strathearn L, Liu B, Yang B, Bao W. (2018). Twenty-Year Trends in Diagnosed Attention-Deficit/Hyperactivity Disorder Among US Children and Adolescents, 1997–2016. JAMA Network Open, 1(4): e181471. https://pmc.ncbi.nlm.nih.gov/articles/PMC6324288/
[4] Child and Adolescent Health Measurement Initiative (CAHMI). 2023 National Survey of Children's Health (NSCH) Data Query: Prevalence of ADD or ADHD, Ages 3–17 Years, Nationwide. Data Resource Center for Child and Adolescent Health, supported by HRSA Maternal and Child Health Bureau. https://nschdata.org/browse/survey/results?q=11488&r=1
[5] Reuben C, Elgaddal N. (2024). Attention-Deficit/Hyperactivity Disorder in Children Ages 5–17 Years: United States, 2020–2022. NCHS Data Brief No. 499. https://www.cdc.gov/nchs/products/databriefs/db499.htm
[6] Danielson ML, Holbrook JR, Bitsko RH, et al. (2022). State-Level Estimates of the Prevalence of Parent-Reported ADHD Diagnosis and Treatment Among U.S. Children and Adolescents, 2016 to 2019. Journal of Attention Disorders, 26(13): 1685–1697. https://pubmed.ncbi.nlm.nih.gov/35603751/
[7] DuPaul GJ, Chronis-Tuscano A, Danielson ML, Visser SN. (2019). Predictors of Receipt of School Services in a National Sample of Youth With ADHD. Journal of Attention Disorders, 23(11): 1303–1319. https://pmc.ncbi.nlm.nih.gov/articles/PMC6557697/
[8] Chronis-Tuscano A, Bounoua N. (2024). ADHD Prevalence Rose, Yet Disparities Remain: Commentary on the 2022 National Survey of Children's Health. Journal of Clinical Child & Adolescent Psychology, 53(3): 361–372. https://pmc.ncbi.nlm.nih.gov/articles/PMC11193851/
[9] He S, Esteban McCabe S, Conti RM, Volerman A, Chua KP. (2025). Prescription Stimulant Dispensing to US Children: 2017–2023. Pediatrics, 155(2): e2024068558. https://pmc.ncbi.nlm.nih.gov/articles/PMC12811066/
[10] Visser SN, Danielson ML, Bitsko RH, et al. (2014). Trends in the Parent-Report of Health Care Provider-Diagnosed and Medicated Attention-Deficit/Hyperactivity Disorder: United States, 2003–2011. Journal of the American Academy of Child & Adolescent Psychiatry, 53(1): 34–46.e2. https://pmc.ncbi.nlm.nih.gov/articles/PMC4473855/
[11] Salari N, Ghasemi H, Abdoli N, et al. (2023). The Global Prevalence of ADHD in Children and Adolescents: A Systematic Review and Meta-Analysis. Italian Journal of Pediatrics, 49: 48. https://pmc.ncbi.nlm.nih.gov/articles/PMC10120242/
[12] Ayano G, Demelash S, Gizachew Y, Tsegay L, Alati R. (2023). The Global Prevalence of Attention Deficit Hyperactivity Disorder in Children and Adolescents: An Umbrella Review of Meta-Analyses. Journal of Affective Disorders, 339: 860–866. https://pubmed.ncbi.nlm.nih.gov/37495084/
[13] Willcutt EG. (2012). The Prevalence of DSM-IV Attention-Deficit/Hyperactivity Disorder: A Meta-Analytic Review. Neurotherapeutics, 9(3): 490–499. https://pmc.ncbi.nlm.nih.gov/articles/PMC3441936/
[14] Paul ML, Sheth P, Davis R, Chrusciel T, Messias E. (2025). Incidence of Attention-Deficit/Hyperactivity Disorder Between 2016 and 2023: A Retrospective Cohort. Psychiatric Research and Clinical Practice, 7(1): 18–24. https://pmc.ncbi.nlm.nih.gov/articles/PMC11956714/
[15] Gomez R, Chen W, Houghton S. (2023). Differences Between DSM-5-TR and ICD-11 Revisions of Attention Deficit/Hyperactivity Disorder: A Commentary on Implications and Opportunities. World Journal of Psychiatry, 13(5): 138–143. https://pmc.ncbi.nlm.nih.gov/articles/PMC10251354/
[16] Johnson S, Lim E, Jacoby P, et al. (2026). Prevalence of Attention Deficit Hyperactivity Disorder/Hyperkinetic Disorder of Pediatric and Adult Populations in Clinical Settings: A Systematic Review, Meta-Analysis and Meta-Regression. Molecular Psychiatry, 31(1): 576–586. https://www.nature.com/articles/s41380-025-03178-8
[17] Hinshaw SP, Nguyen PT, O'Grady SM, Rosenthal EA. (2022). Annual Research Review: Attention-Deficit/Hyperactivity Disorder in Girls and Women — Underrepresentation, Longitudinal Processes, and Key Directions. Journal of Child Psychology and Psychiatry, 63(4): 484–496. https://acamh.onlinelibrary.wiley.com/doi/10.1111/jcpp.13480
[18] Peterson BS, Trampush J, Maglione M, et al. (2024). Treatments for ADHD in Children and Adolescents: A Systematic Review. Pediatrics, 153(4): e2024065787. https://publications.aap.org/pediatrics/article/153/4/e2024065787/196922/
[19] Zhang J, et al. (2023). Screen Time and Childhood Attention Deficit Hyperactivity Disorder: A Meta-Analysis. International Journal of Adolescent Medicine and Health. https://pubmed.ncbi.nlm.nih.gov/37163581/
[20] Martin AF, Rubin GJ, Rogers MB, et al. (2025). The Changing Prevalence of ADHD? A Systematic Review. Journal of Affective Disorders, 387. https://www.sciencedirect.com/science/article/pii/S0165032725008638
[21] Paulich KN, et al. (2025). Association of Screen Time With Attention-Deficit/Hyperactivity Disorder Symptoms and Their Development: The Mediating Role of Brain Structure. Translational Psychiatry. https://www.nature.com/articles/s41398-025-03672-1
[22] McKechnie DGJ, O'Nions E, Bailey J, Hobbs L, Gillespie F, Petersen I. (2023). Attention-Deficit Hyperactivity Disorder Diagnoses and Prescriptions in UK Primary Care, 2000–2018: Population-Based Cohort Study. BJPsych Open, 9(4): e121. https://www.cambridge.org/core/journals/bjpsych-open/article/attentiondeficit-hyperactivity-disorder-diagnoses-and-prescriptions-in-uk-primary-care-20002018-populationbased-cohort-study/
This guide synthesizes peer-reviewed research published through early 2026. Statistics are drawn from the most recent nationally representative U.S. surveys (NSCH 2022 and 2023, NHIS 2017–2022) and global meta-analyses available in peer-reviewed literature. If you suspect your child has ADHD, please consult a pediatrician or qualified mental-health professional — population statistics don't replace an individual evaluation.


Comments
Your comment has been submitted