TL;DR:About 8.85% of US children ages 6-17 (roughly 1 in 11) have ever been diagnosed with a learning disability, and 8.26% currently have one, according to the most recent peer-reviewed analysis of national survey data. That's roughly several million school-age kids. Boys are diagnosed at nearly 1.6 times the rate of girls, and there's a real diagnosis gap by income, race, and parental education. Outcomes for these students remain difficult: roughly two-thirds of 8th-grade students with disabilities scored below basic in reading on the most recent national assessment, and nearly three-quarters in math.
Learning disability (LD) - clinically termed Specific Learning Disorder in the DSM-5 and ICD-11 - refers to a group of neurodevelopmental conditions marked by persistent difficulty with listening, speaking, reading, writing, reasoning, or mathematics. The clinical definition requires that the difficulty has lasted at least six months, that performance is substantially below age expectations, that it began during childhood, and that it isn't better explained by something else, like an intellectual disability or inadequate instruction [1].
Learning disabilities are common enough that almost every classroom has at least one or two children navigating one, yet the condition gets far less public attention than ADHD or autism. This guide pulls together the most current peer-reviewed and federal US data on how many children are affected, who's most likely to be diagnosed, how that's changed over time, and what it means for school services and outcomes.
A note on recency: NSCH 2024 microdata has been released by the Census Bureau, and analyses of the combined 2023-2024 survey wave have begun appearing on other topics. As of this writing, no peer-reviewed analysis specifically reporting 2024 learning disability prevalence has been published, so the 2023 figures here remain the most current available estimates for this condition.
Key Learning Disability Statistics for 2026
How Common Are Learning Disabilities in US Children?
The most recent peer-reviewed analysis of National Survey of Children's Health (NSCH) data, published in PLOS ONE in October 2025, found that 8.85% of US children aged 6-17 have ever been diagnosed with a learning disability, and 8.26% currently have one. That's based on a sample of 221,244 children surveyed between 2016 and 2023 - one of the largest and most current looks at this question available.[1]
A separate analysis of National Health Interview Survey (NHIS) data, published in JAMA Pediatrics, covering 1997 through 2021, found a very similar overall figure: 8.83% prevalence across that 24-year window [2]. The two surveys broadly agree on the current scale of the issue.
Learning Disabilities by Age
Prevalence is meaningfully higher among older kids:
Ages 6-11: 7.92% ever-diagnosed, 7.54% current [1]
Ages 12-17: 9.74% ever-diagnosed, 8.96% current [1]
This pattern shows up consistently across both NSCH and NHIS data, and it likely reflects more years of exposure to evaluation rather than the condition itself becoming more common with age - older kids have simply had more opportunities to be screened, struggle visibly, and get a formal diagnosis [1].
Is the Rate Rising?
The two surveys disagree here. NSCH data shows ever-diagnosed LD prevalence rising from 7.86% to 9.15% between 2016 and 2023, a statistically significant 16.4% relative increase [1]. NHIS data, covering a much longer 1997-2021 window, found no significant change over time - prevalence moved from 8.98% in 1997-98 to 8.31% in 2021, which was not statistically significant [2]. The two surveys use different methodologies and ask the question slightly differently, which likely explains the gap rather than one being simply wrong. Some of the increase in diagnoses may be due to parents having a broader understanding and less stigma around seeking a diagnosis. [1]
Who Gets Diagnosed? Sex, Race, and Family Background
Boys vs. Girls
Boys are diagnosed with a learning disability at close to 1.6 times the rate of girls - 10.75% of boys vs. 6.85% of girls, ever-diagnosed [1]. The NHIS data shows an almost identical gap (11.00% boys vs. 6.56% girls) [2]. Researchers have suggested that girls may have some advantage in verbal working memory and early literacy skills, which could mean their learning difficulties are less likely to be flagged early - a pattern of underdiagnosis similar to what's been documented in ADHD and autism [1].
Notably, the NSCH data found statistically significant increases for both sexes between 2016 and 2023, with the female trend showing stronger statistical significance - which may reflect improving (if still incomplete) recognition of learning disabilities in girls [1].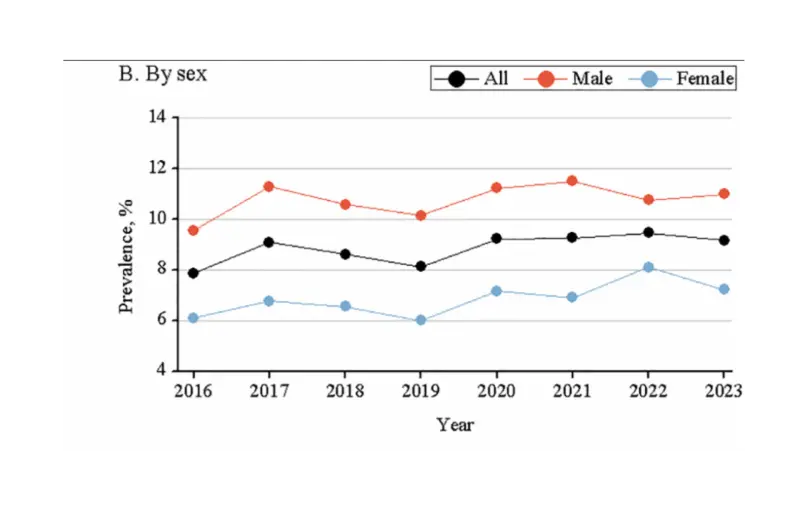
Race and Ethnicity
Prevalence varies by race and ethnicity, and the two surveys broadly agree on the ranking [1][2]:
Non-Hispanic Black children: 11.47% (NSCH) / 10.03% (NHIS)
Non-Hispanic White children: 8.79% (NSCH) / 9.25% (NHIS)
Hispanic children: 8.25% (NSCH) / 7.82% (NHIS)
Other race/ethnicity groups: 7.23% (NSCH) / 6.23% (NHIS)
Non-Hispanic Black children show the highest prevalence in both surveys. Researchers studying these gaps have pointed to differences in healthcare access and language barriers as likely contributors to the lower reported rates among Hispanic families, rather than any difference in true underlying prevalence [1].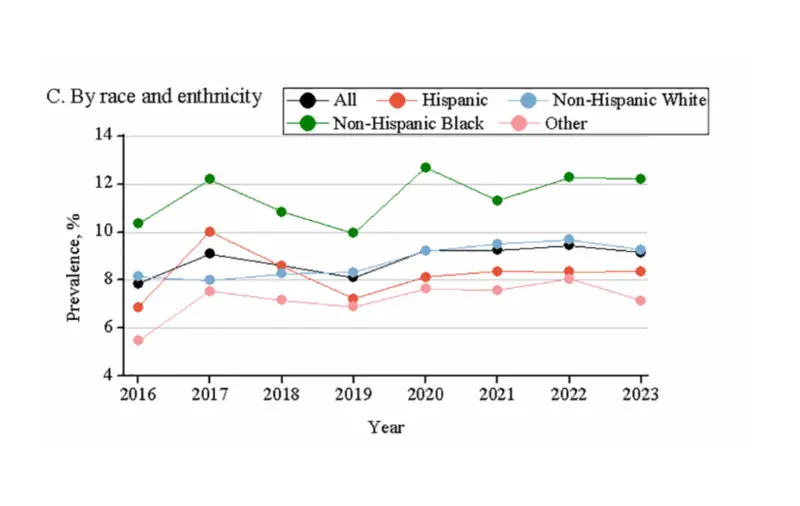
Family Income and Education
Both surveys show that kids from lower-income families are diagnosed with learning disabilities at higher rates than kids from wealthier ones - roughly double, in fact (13.46% vs. 6.59% in NHIS; 12.16% vs. 6.58% in NSCH) [1][2]. Parental education shows a similar but less consistent pattern across the two surveys.
State-by-State Variation
Diagnosed learning disability rates vary substantially by state. Based on NSCH 2016-2023 data, diagnosis rates ranged from a low of 6.18% (ever-diagnosed) in Utah to a high of 12.84% in New Hampshire - more than double [1]. Current-diagnosis rates follow a similar pattern: 5.82% in Utah versus 11.86% in New Hampshire.
A separate but related measure - the share of students actually receiving IDEA-covered special education services (which includes learning disabilities plus other categories) - also varies by state. For the 2022-23 school year, IDEA service rates ranged from 12% (Hawaii, Idaho) to 21% (New York, Maine, Pennsylvania) [3]. A twofold-plus gap between high and low states points to real differences in screening practices, healthcare access, and reporting culture, rather than children's underlying rates of difficulty varying that much by geography.
Learning Disabilities and ADHD: A Common Combination
Learning disabilities often occur alongside ADHD. An analysis of nationally representative U.S. data found that learning disability was the most common co-occurring developmental condition among children with ADHD, affecting 36.5% of children with the condition [5].
Because attention, executive function, and learning challenges can influence one another, it's important to evaluate and support both rather than assuming academic difficulties are caused by ADHD alone.
For families navigating both, our guide on ADHD statistics in the US covers the broader picture in more depth.
Learning Disabilities at School: IEPs, 504 Plans, and Inclusion
Most children with a diagnosed learning disability are eligible for some form of school-based support, typically through an Individualized Education Program (IEP) under the Individuals with Disabilities Education Act (IDEA) or a 504 plan under Section 504 of the Rehabilitation Act.
7.5 million US students (15.2% of all public school students) received some form of IDEA-covered special education service in 2022-23, up from 6.4 million (13.1%) a decade earlier [3][4].
2.4 million of those students were classified under "Specific Learning Disability" - about 32% of all IDEA-served students, and roughly 4.9% of total US public school enrollment, making SLD the largest single disability category under IDEA [4].
76% of students with Specific Learning Disabilities spent 80% or more of their school day in general education classrooms in Fall 2022, reflecting a long-term shift toward inclusive education over segregated special-education settings [8].
Students with disabilities served only under Section 504 accounted for 4% of total K-12 enrollment in 2021-22, according to the U.S. Department of Education's Civil Rights Data Collection - covering students who receive accommodations under Section 504 but don't qualify for an IEP under IDEA [7].
It's worth noting that IDEA's "specific learning disability" category bundles dyslexia, dyscalculia, dysgraphia, and other subtypes together at the federal reporting level - schools don't break this figure out by subtype in publicly available national data, which is one reason a subtype-specific national number (e.g., "how many US children specifically have dyscalculia") is harder to pin down than the overall learning disability figure. If your child's IEP or 504 plan needs a refresh, our guide on building a math IEP that actually helps covers what's worth asking for.
Outcomes: How Students with Disabilities Are Doing in School
Even with services in place, students with learning disabilities and other disabilities continue to face wide achievement gaps. The most recent National Assessment of Educational Progress (NAEP), known as the Nation's Report Card, paints a difficult picture:
On the 2024 NAEP, 66% of 8th-grade students with disabilities scored below basic in reading - the lowest achievement category - and 74% scored below basic in math [8][9]. Both figures reflect ongoing declines since 2019.
For comparison, 29% of all 8th-graders scored proficient or above in reading in 2024, and 27% in math - already low numbers that are themselves down from pre-pandemic levels [8][9].
The graduation picture is more encouraging, though still uneven. Among students with disabilities aged 14-21 who exited school in 2021-22 [6]:
74% graduated with a regular high school diploma
15% dropped out
10% received an alternative certificate
These outcomes underscore that diagnosis and services are only part of the picture. What happens inside the classroom - quality of instruction, fit of accommodations, teacher training in learning disabilities - shapes whether identification actually leads to better learning, or stays as a label without traction.
FAQs:
How many US children have a learning disability in 2026?
The most recent peer-reviewed estimate, based on 2016-2023 National Survey of Children's Health data, found that 8.85% of US children aged 6-17 have ever been diagnosed with a learning disability, and 8.26% currently have one [1]. A separate, longer-running survey (NHIS) puts the figure at a very similar 8.83% across 1997-2021 [2].
Are boys more likely than girls to have a learning disability?
Yes. Boys are diagnosed at roughly 1.6 times the rate of girls (around 11% vs. 6.5-6.9%, depending on the survey) [1][2]. Researchers believe this partly reflects genuine differences and partly reflects underdiagnosis in girls, similar to patterns seen in ADHD and autism.
What's the difference between an IEP and a 504 plan?
An IEP, governed by IDEA, provides specialized instruction and is available to students who need that level of support. A 504 plan, governed by Section 504 of the Rehabilitation Act, provides accommodations (like extra time or preferential seating) within the general classroom and has a broader eligibility standard. A student can have one or, less commonly, both [4][7].
How well do students with disabilities do in school?
Outcomes are mixed. On the 2024 NAEP, 66% of 8th-grade students with disabilities scored below basic in reading, and 74% in math [8][9]. On the more positive side, 74% of students with disabilities aged 14-21 who exited school in 2021-22 graduated with a regular high school diploma [6].
Which US states have the highest rates of diagnosed learning disabilities?
Based on 2016-2023 NSCH data, New Hampshire had the highest rate (12.84% ever-diagnosed) and Utah the lowest (6.18%) - more than a twofold difference [1]. By the separate measure of how many students actually receive IDEA services (which includes other disabilities too), New York, Maine, and Pennsylvania top out at 21%, and Hawaii and Idaho sit at 12% [3].
References
Xu C, Li Y, Yu H, et al. (2025). Rising prevalence of parent-reported learning disabilities among U.S. children and adolescents aged 6-17 years: NSCH, 2016-2023. PLOS ONE, 20(10): e0333850. https://doi.org/10.1371/journal.pone.0333850
Li Y, Li Q, Zheng J, et al. (2023). Prevalence and Trends in Diagnosed Learning Disability Among US Children and Adolescents From 1997 to 2021. JAMA Pediatrics, 177(9): 969-972. https://doi.org/10.1001/jamapediatrics.2023.2117
National Center for Education Statistics. (2024). Students With Disabilities. Condition of Education. U.S. Department of Education, Institute of Education Sciences. https://nces.ed.gov/programs/coe/indicator/cgg
National Center for Education Statistics. (2023). Children 3 to 21 years old served under IDEA, Part B, by type of disability: 1976-77 through 2022-23. Digest of Education Statistics, Table 204.30. https://nces.ed.gov/programs/digest/d23/tables/dt23_204.30.asp
Danielson ML, et al. ADHD prevalence among U.S. children and adolescents in 2022: Diagnosis, severity, co-occurring conditions, and treatment. Journal of Clinical Child & Adolescent Psychology. 2024. https://pmc.ncbi.nlm.nih.gov/articles/PMC11334226/
National Center for Education Statistics. (2023). Percentage distribution of students with disabilities ages 14-21 served under IDEA, Part B, by exit reason: 2021-22. Digest of Education Statistics, Table 219.90. https://nces.ed.gov/programs/digest/d23/tables/dt23_219.90.asp
U.S. Department of Education, Office for Civil Rights. (2025). 2021-22 Civil Rights Data Collection: A First Look — Students' Access to Educational Opportunities in U.S. Public Schools. https://www.ed.gov/media/document/2021-22-crdc-first-look-report-109194.pdf
National Assessment of Educational Progress (NAEP). 2024 Reading Report Card for the Nation, Grades 4 and 8: National Trends and Student Skills. The Nation's Report Card, NCES. https://www.nationsreportcard.gov/reports/reading/2024/g4_8/national-trends/?grade=4
National Assessment of Educational Progress (NAEP). 2024 Mathematics Report Card for the Nation, Grades 4 and 8. The Nation's Report Card, NCES. https://www.nationsreportcard.gov/reports/mathematics/2024/g4_8/?grade=4
National Center for Education Statistics. (2023). Children and youth with disabilities served under IDEA, Part B, by educational environment: Fall 2022. Digest of Education Statistics, Table 204.60. https://nces.ed.gov/programs/digest/d23/tables/dt23_204.60.asp