In U.S. K–12 education, “online learning” typically refers to the digital systems schools use to deliver instruction, assign work, assess learning, and communicate with students and families.
Here are the most recent statistics available:
What counts as “online learning” in U.S. K–12?
Does “online learning” only mean full-time virtual school?
No. In most K–12 reporting, “online learning” includes both full-time virtual schools and the digital tools used in regular (in-person) schools.
Fully online schools (virtual schools): students attend primarily online.
Online course offerings: online electives, credit recovery, or state virtual course catalogs.
Hybrid/blended learning: mix of in-person instruction plus online components.
Day-to-day digital learning tools: Learning management systems (LMS), digital assignments, online assessments, adaptive practice platforms, tutoring systems, instructional videos, and interactive educational apps and games used for instruction or practice.
Infrastructure: 1:1 devices, school internet, take-home policies, digital literacy instruction, and home connectivity supports.
1) Device access and 1:1 computing in U.S. public schools
How many U.S. public schools have a 1:1 computing program (one device per student)?
88% of public schools reported having a 1-to-1 computing program in the 2024–25 school year.[1]
In 1:1 schools, what types of devices are most common?
Do schools let students take devices home?
46% of 1:1 schools allow devices to go home on school days and weekends.[1]
37% do not allow devices to go home.[1]
How did device support change during COVID (pre vs. during pandemic)?
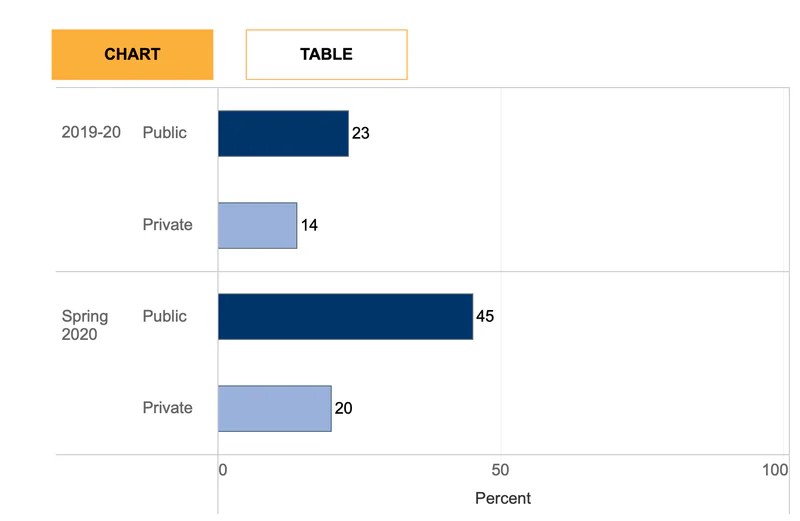
Before COVID (2019–20):23% of public school principals reported assigning devices to all students to take home (vs. 14% in private schools).[2]
Early COVID (Spring 2020): the public school figure rose to 45% (vs. 20% in private schools).[2]
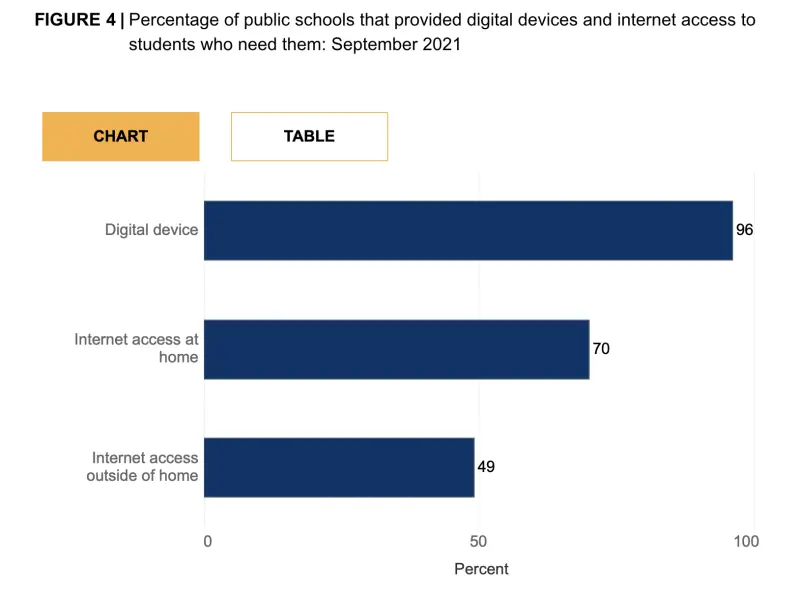
At the start of 2021–22, how many schools provided devices and internet support to students who needed it?
96% of public schools reported providing digital devices to students who needed them.[2]
70% provided internet access at home to students who needed it.[2]
49% provided internet access at locations other than home (e.g., libraries/community sites) to students who needed it.[2]
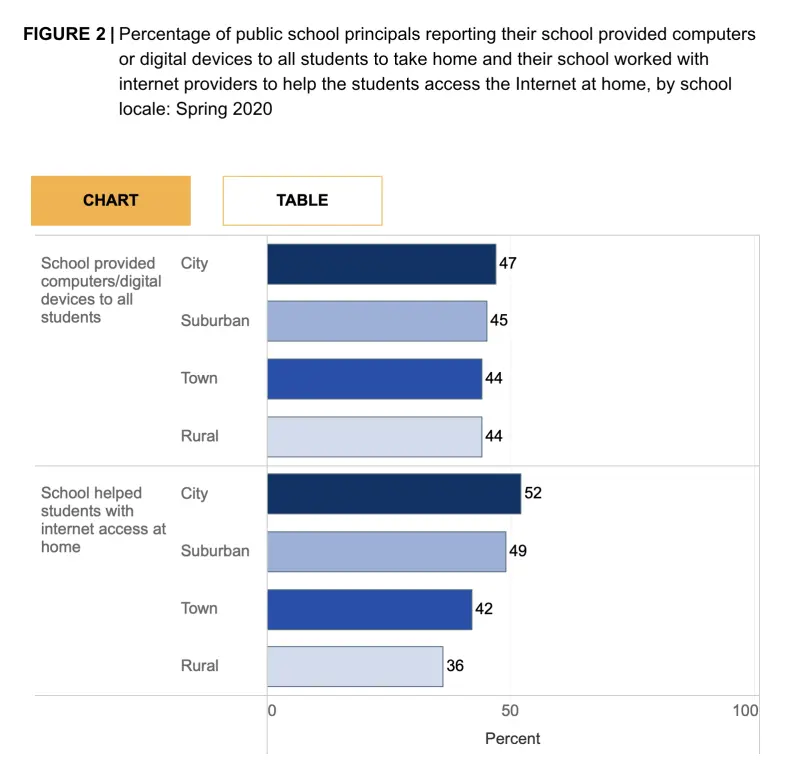
Were there rural vs. urban differences in early pandemic internet support?
Schools working with internet providers to help students access internet at home: City 52%, Suburban 49%, Town 42%, Rural 36%.[2]
2) Connectivity: Internet availability in schools (and home broadband support)
How many public schools have high-speed internet available to students across all school grounds/buildings?
77% reported high-speed internet across all grounds and buildings (2024–25).[1]
21% reported high-speed internet across buildings but not all grounds.[1]
1% reported it only in some rooms.[1]
Are districts still helping students get home broadband access?
From the CoSN 2024 State of EdTech District Leadership survey (digital equity section):
31% of districts reported they no longer provide any services to address student home broadband access (compared to 19% two years ago).[7]
The number of districts providing hotspots to unconnected students declined from 69% (2022) to 49% (2024)..[7]
75% of respondents reported having students without home broadband access; 17% said they didn’t know the status of student broadband access.[7]
Only 24% of districts reported that all students have access to devices at home.[7]
3) Teacher use of digital tools
How often do teachers use EdTech in day-to-day work?
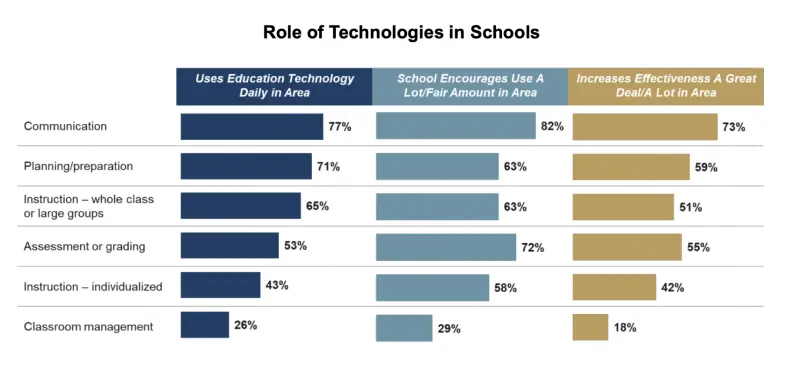
In an Aug 2023 national survey, large majorities of teachers reported daily EdTech use for core tasks.[5]
77% use EdTech daily for communication.[5]
71% use EdTech daily for planning & preparation.[5]
65% use EdTech daily for whole-class instruction.[5]
What hardware devices do teachers use for their work?
Education technology is not limited to software - most teachers rely on multiple hardware devices as part of their daily workflow.[5]
97% use laptop computers for work; 83% use them daily.
70% use smartphones for work; 34% use them daily.
73% use interactive whiteboards; 56% use them daily.
What percent of teachers use a learning management system (LMS)?
85% of teachers reported using an LMS occasionally or daily.[5]
4) Teacher and parent attitudes toward education technology (2023)
Do teachers think EdTech helps learning?
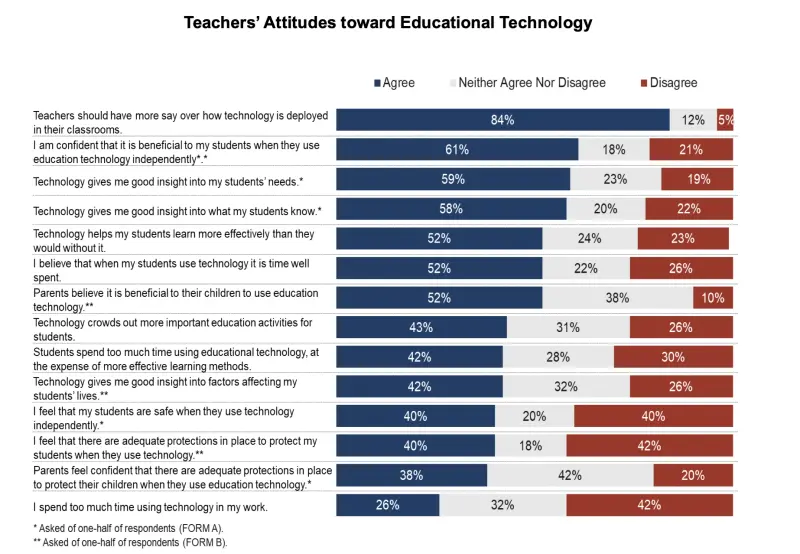
61% agree it’s beneficial when students use EdTech independently.[5]
59% say EdTech gives insight into what students need; 58% say it helps show what students know.[5]
Do teachers worry about overuse?
35% say students spend too much time using EdTech; 47% say the right amount; 18% say not enough.[5]
84% say teachers should have more say over how technology is deployed.[5]
Teachers reporting little/no control: 67% hardware selection; 55% software selection; 76% school rollout of new technology.[5]
Are parents generally positive about EdTech?
76% have a favorable view of how technology supports learning; 74% say EdTech positively impacts their child’s learning.[5]
66% say their child spends the right amount of time using EdTech.[5]
86% support continuing or increasing technology use; 54% want schools to use more technology in the future.[5]
What do parents say kids use EdTech for most often?
Assignments/projects: 77%; exploring topics of interest: 51%; improving in a subject: 46%; communicating with teachers: 46%.[5]
5) AI classroom usage in U.S. K–12
How many teachers are using AI tools?
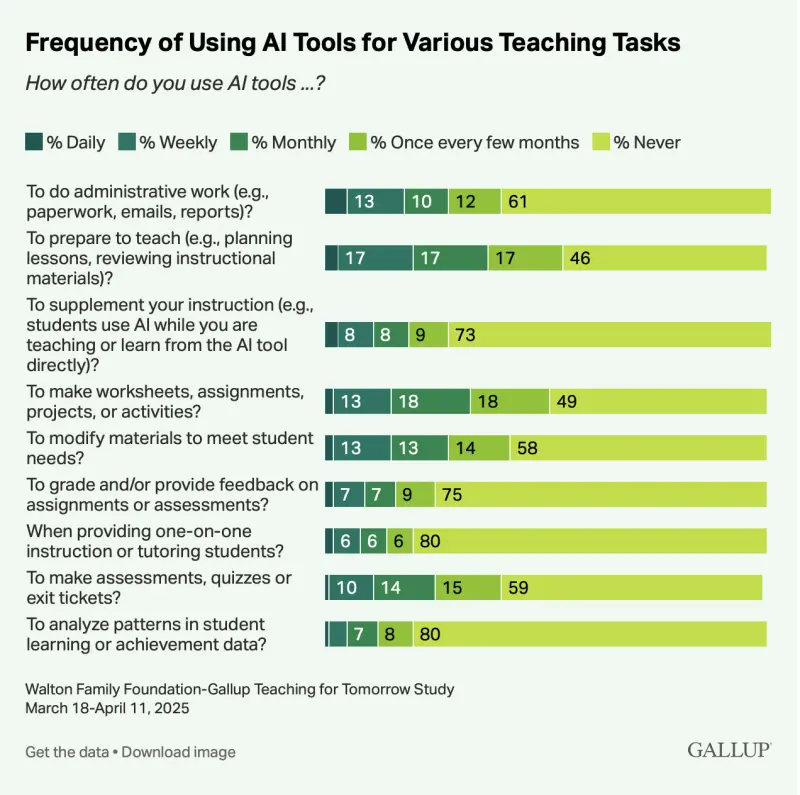
60% of public K–12 teachers reported using AI tools in 2024–25.[3]
32% reported using AI weekly (surveyed Mar–Apr 2025).[3]
Do schools have AI policies and training in place?
31% of public schools reported a written policy on student AI use (2024–25).[1]
67% reported providing AI training to at least some staff/teachers (2024–25).[1]
How common is AI use by teachers inside schools (school-reported)?
73% of public schools reported at least a few teachers using AI for tasks like lesson planning, tailored materials, assessments, or grading (2024–25).[1]
32% reported using software to identify whether student work was AI-generated (2024–25).[1]
Do teachers think AI in K–12 does more harm than good?
25% say AI tools do more harm than good; 32% say equal mix of harm and benefit; 6% say more good than harm; 35% aren’t sure.[4]
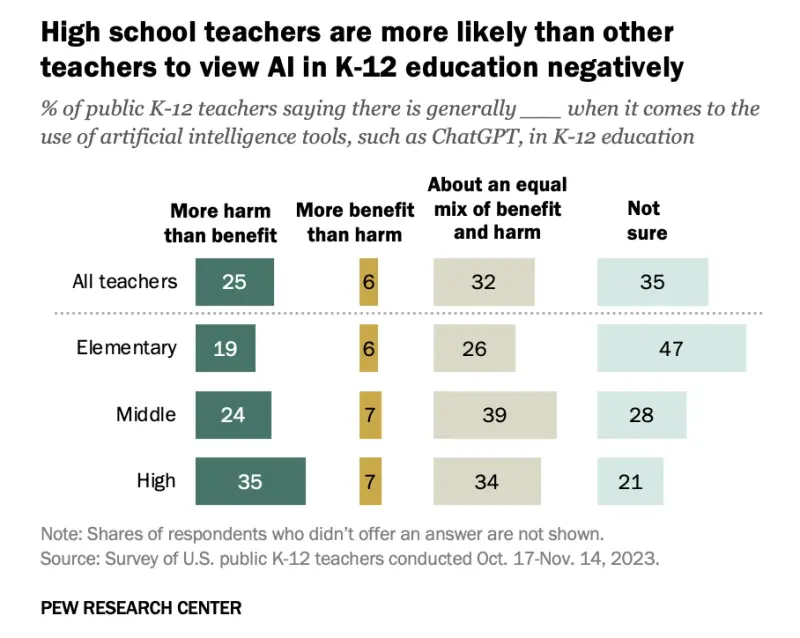
By grade band: 35% of high school teachers say more harm than good vs. 24% middle school and 19% elementary (Fall 2023).[4]
Are districts formalizing generative AI initiatives?
In CoSN’s district survey, 35% reported having a generative AI initiative, and 97% said they see benefits in how AI can positively impact education.[7]
These CoSN figures reflect district EdTech leader survey responses (not a national teacher poll), but they help describe district-level AI strategy momentum.[7]
6) Digital literacy instruction
How many public schools teach digital literacy?
68% offer digital literacy training to students; 61% say it’s part of a formal/structured curriculum (2024–25).[1]
Common approaches: library/media lab training (57%) and embedding digital literacy in core subjects (54%).[1]
Sources :
[1] IES/NCES School Pulse Panel press release (Feb 19, 2025): https://ies.ed.gov/learn/press-release/more-half-public-school-leaders-say-cell-phones-hurt-academic-performance
[2] NCES “Technology Support” (NTPS, HPS, SPP comparisons; 2019–2021): https://nces.ed.gov/surveys/annualreports/topical-studies/covid/theme/elementary-and-secondary-education-technology-support/
[3] Gallup (June 25, 2025) “Three in 10 Teachers Use AI Weekly…” (includes links to report/PDF): https://news.gallup.com/poll/691967/three-teachers-weekly-saving-six-weeks-year.aspx
[4] Pew Research Center (May 15, 2024) teacher views on AI: https://www.pewresearch.org/short-reads/2024/05/15/a-quarter-of-u-s-teachers-say-ai-tools-do-more-harm-than-good-in-k-12-education/
[5] AFT/Hart Research memo (Sept 18, 2023) “Surveys of Teachers and Parents on Educational Technology”: https://www.aft.org/sites/default/files/media/documents/2023/ME-14570_AFT_Teacher_Parent_Tech_Surveys_MEMO.pdf
[6] CoSN 2024 report page (hub): https://www.cosn.org/tools-and-resources/resource/2024-state-of-edtech-district-leadership-survey/
[7] CoSN 2024 report PDF: https://www.cosn.org/wp-content/uploads/2024/04/2024_CoSN_LeadershipSurvey_Report_F1.pdf
[8] GovTech summary referencing CoSN home broadband/hotspot declines: https://www.govtech.com/education/k-12/cosn-report-surging-demands-on-ed-tech-leaders-with-limited-resources
[9] NEPC landing page (Virtual Schools in the U.S. 2023): https://nepc.colorado.edu/publication/virtual-schools-annual-2023
[10] ERIC full-text PDF (Virtual Schools in the U.S. 2023): https://files.eric.ed.gov/fulltext/ED628827.pdf
[11] ListedTech LMS market share perspective (2024): https://listedtech.com/blog/the-state-of-the-lms-market-in-2024-trends-in-k-12/