How Many US Kids Are Behind Grade-Level in Math in 2025?
TL;DR
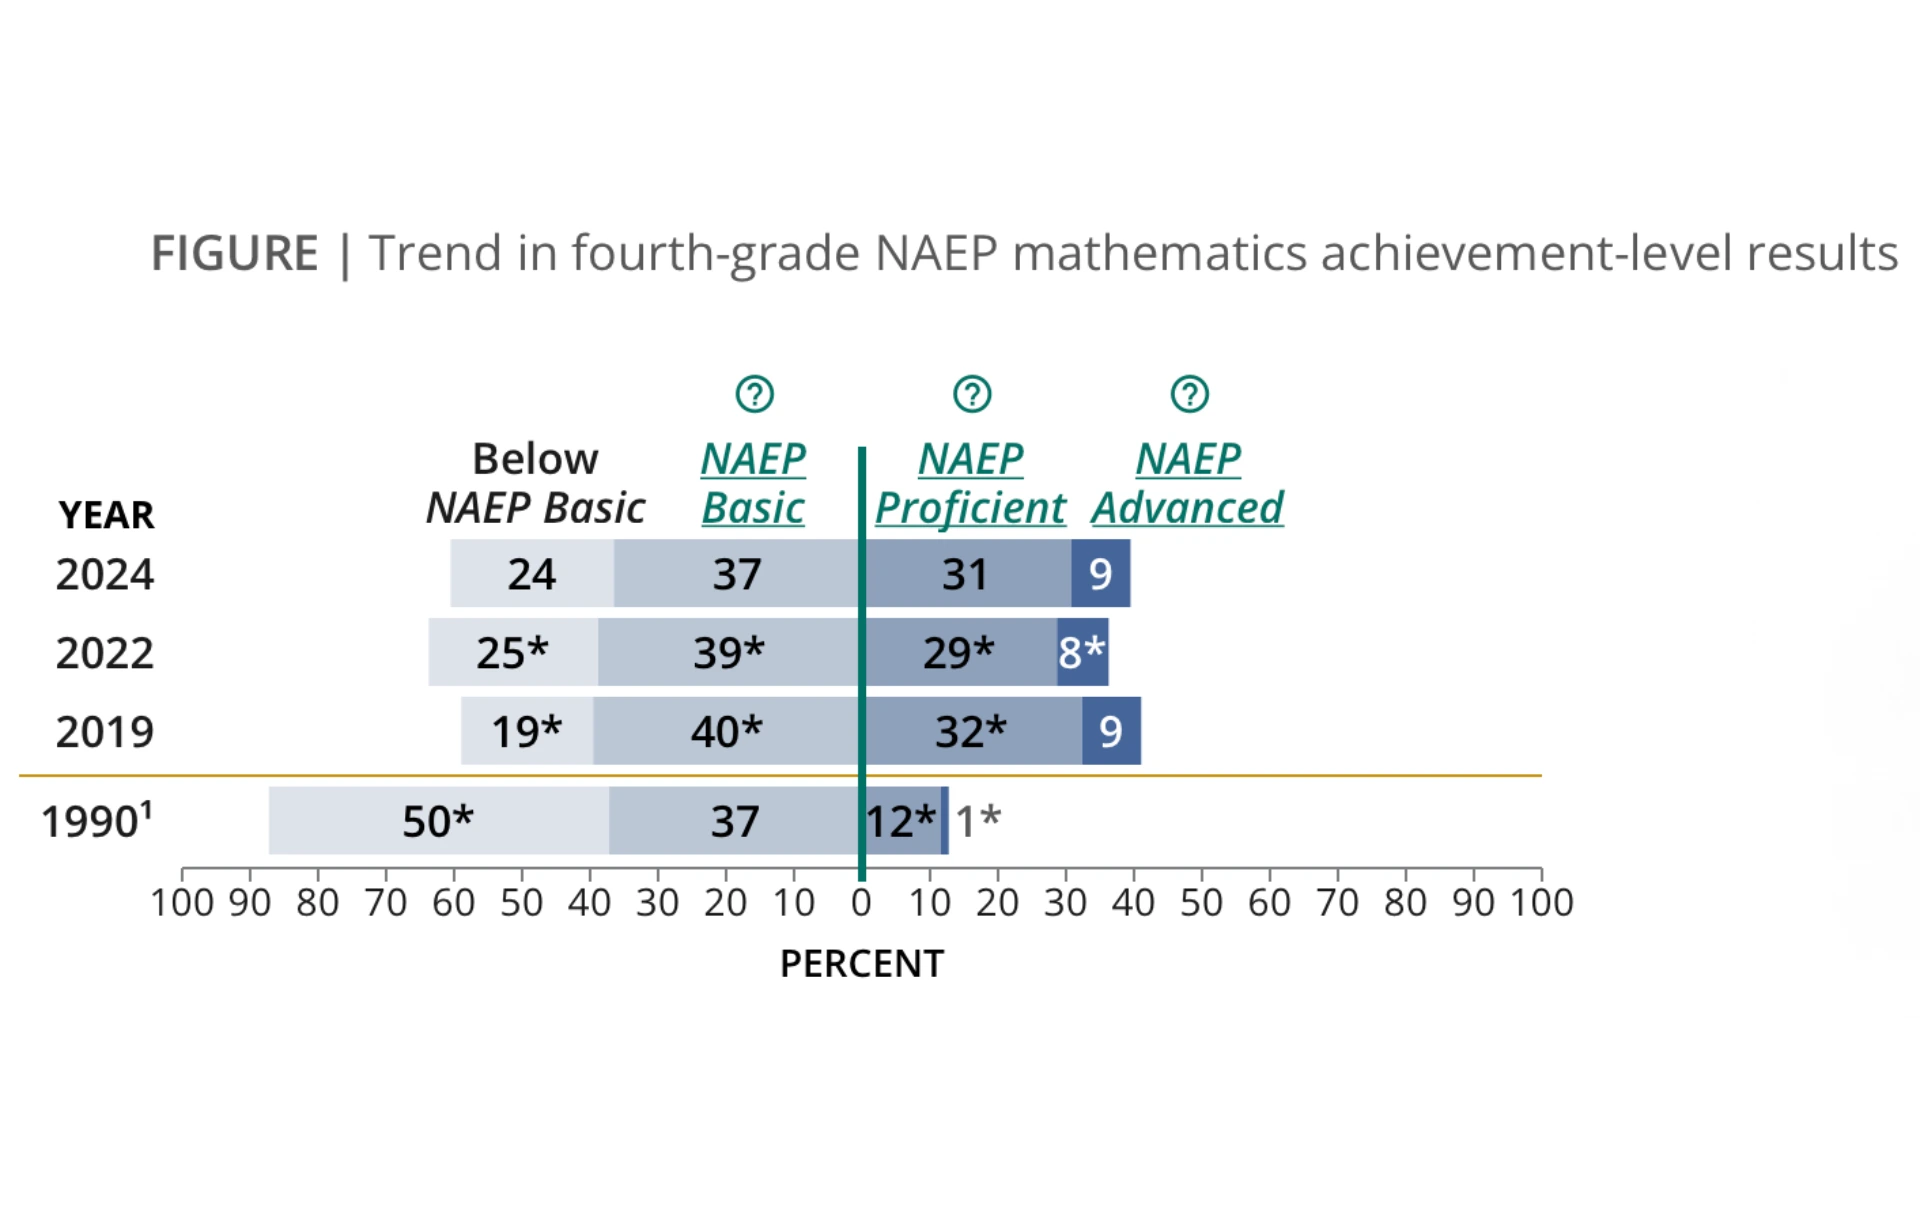
- Only ~40% of fourth graders performed at or above the NAEP Proficient level in math in 2024, per the NAEP mathematics results (Grades 4 & 8, 2024).
- About a quarter (24%) of fourth graders scored below the NAEP Basic level - meaning many may not meet grade-level expectations - in the same NAEP dataset.
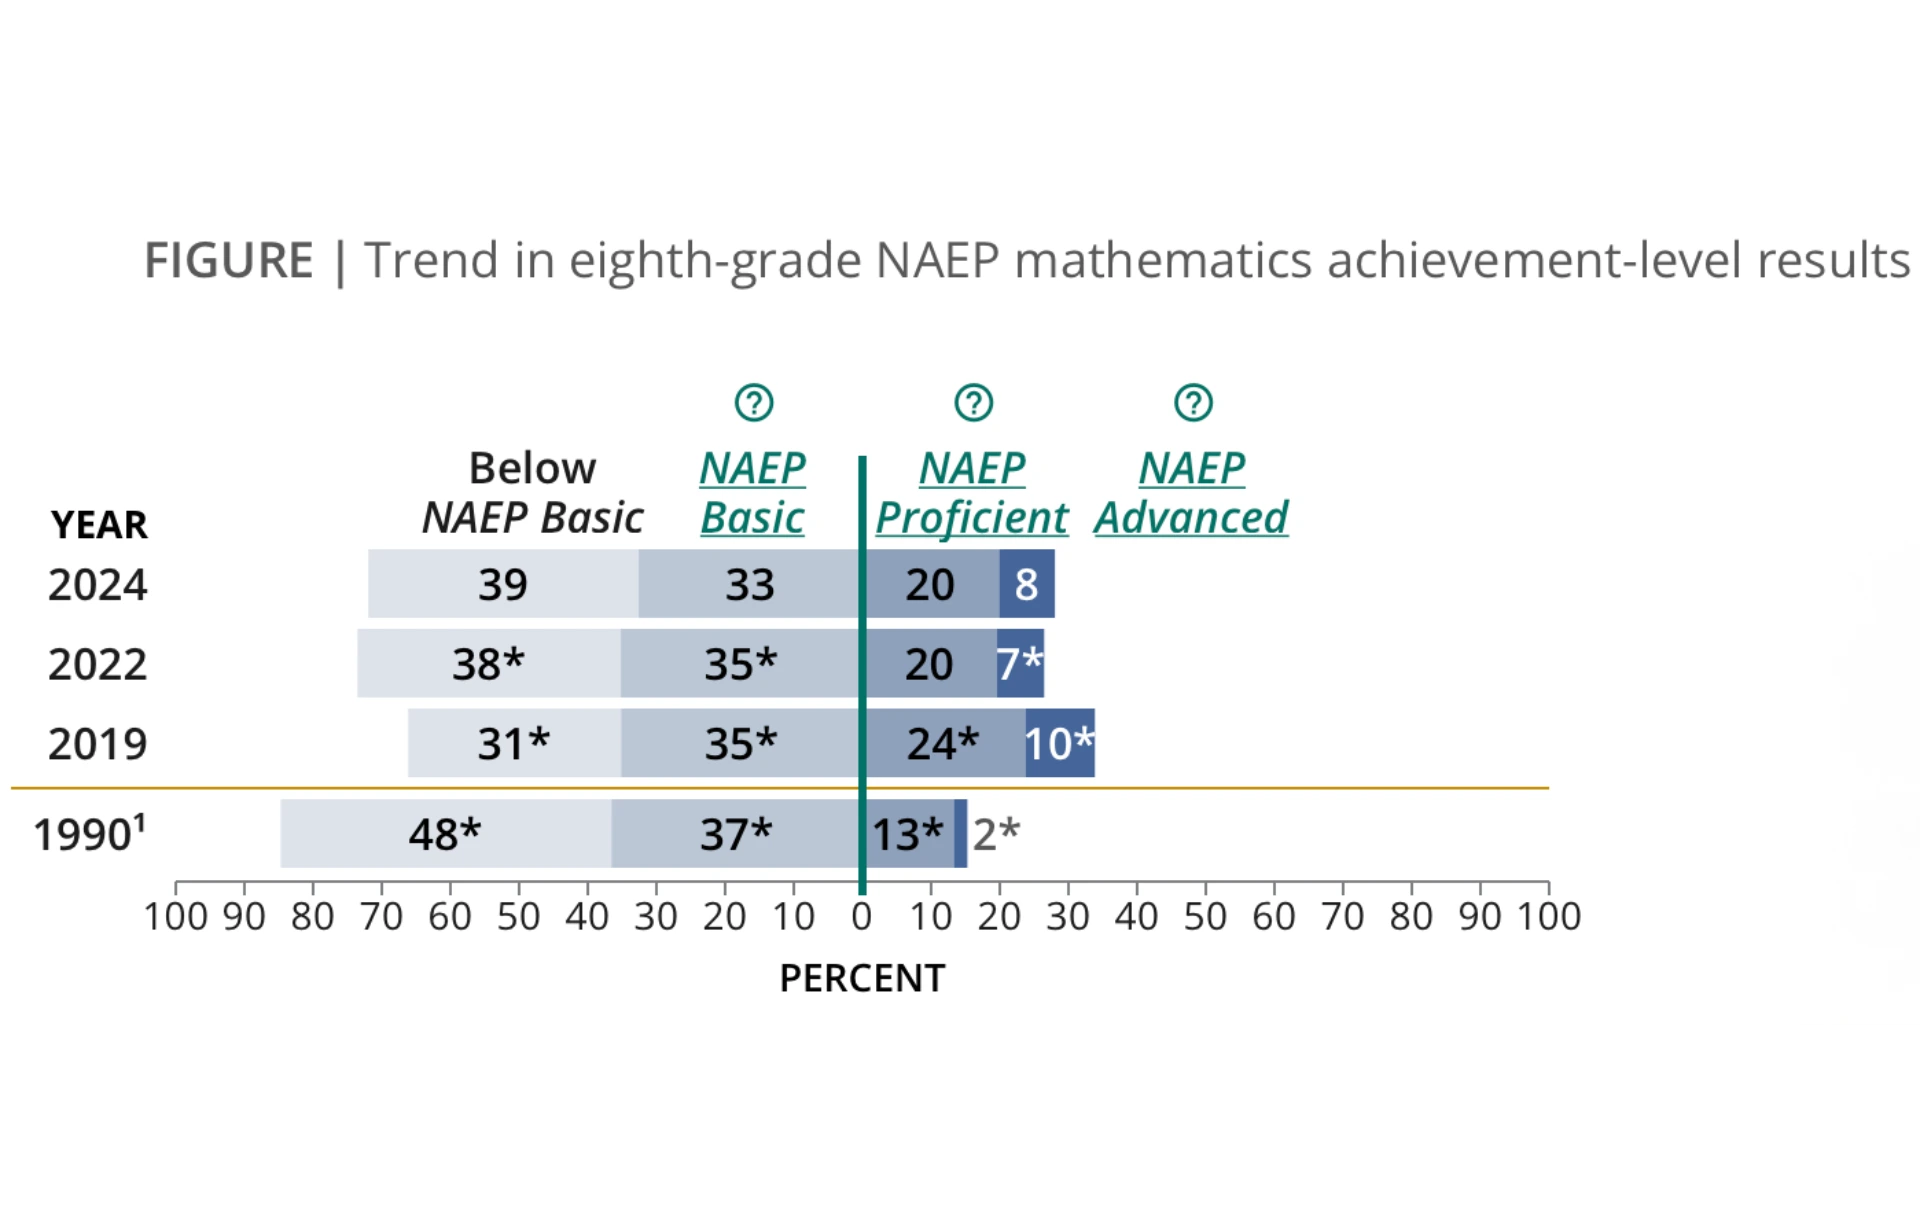
- Less than one-third (roughly 28%) of eighth graders reached Proficient math performance in 2024, per NAEP Grades 4 & 8 math results. 39% scored below the Basic level
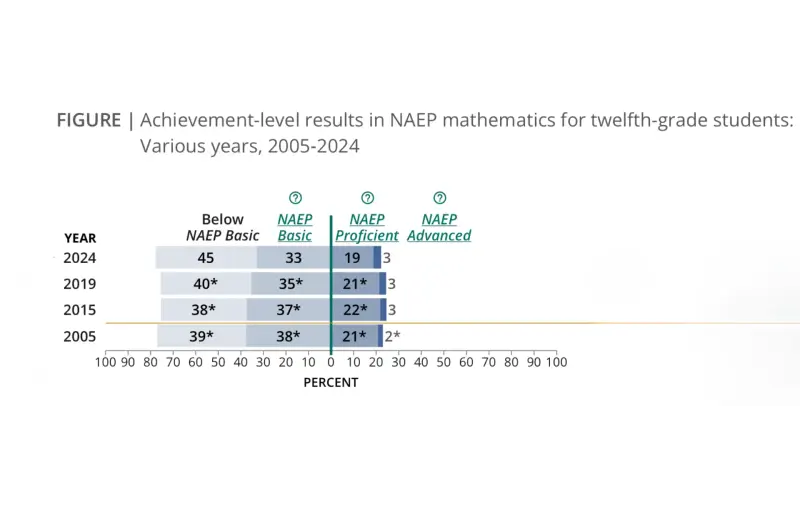
- Just ~22% of 12th graders scored at or above NAEP Proficient in math; 45% scored below the Basic level, per the NAEP Grade 12 mathematics results (2024).
- District-level recovery data shows the average U.S. student was still nearly half a grade level behind pre-pandemic achievement in math as of spring 2024, while 17% of grades 3–8 students were in districts with mean math achievement above 2019 levels.
If you’re curious (or worried) about how U.S. students are doing in math, you’re not alone. In 2025, educators, parents, and policymakers are scrutinizing data on math proficiency like never before - and the numbers tell a story that’s both sobering and crucial to understand. In this deeply researched, stats-focused guide, we break down the latest evidence on how many American kids are behind grade level in math, why it matters, and what the trends mean going forward.
Why Math Proficiency Data Matters
Before we jump into numbers, it helps to understand how proficiency is measured in the U.S. The National Assessment of Educational Progress (NAEP), often called the "Nation’s Report Card," regularly assesses students in grades 4, 8, and 12 on math (among other subjects) using standardized tests administered to representative samples of students across the country. These results give us a snapshot of how well students are performing relative to established achievement levels like Basic and Proficient.
Basic means denotes partial mastery of prerequisite knowledge and skills that are fundamental for performance at the NAEP Proficient level. Proficient means solid academic performance for each NAEP assessment, demonstrating competency over challenging subject matter knowledge, application of such knowledge to real world situations and analytical skills appropriate to this subject matter.
How Many Students Are Performing Below Grade-Level?
Let’s start with the big picture: the latest nationally representative data shows that a majority of U.S. students are not hitting strong proficiency marks in math - and a significant share are below even the most basic benchmarks.
Fourth Graders (Grade 4)
According to the 2024 NAEP mathematics assessment, just under 40% of fourth graders were at or above the NAEP Proficient level - a proxy for solid grade-level mathematics understanding - while roughly 24% scored below the Basic level. Scoring below Basic suggests students may lack fundamental skills expected for their grade.
Eighth Graders (Grade 8)
Middle school students didn’t fare much better: only about 28% of eighth graders scored at or above Proficient, based on the same 2024 NAEP dataset. That means more than two-thirds are not reaching proficient level of competency for what is expected of their grade level.
High School Seniors (Grade 12)
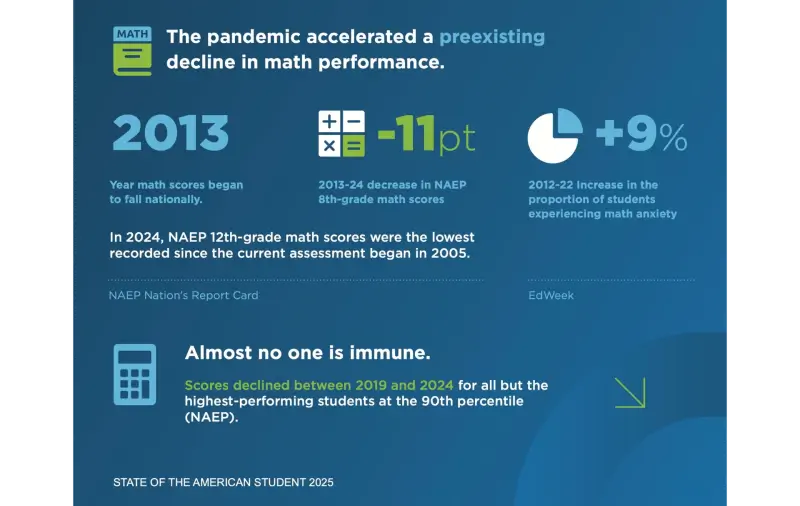
The picture gets more concerning in the senior year of high school. The 2024 NAEP results show only around 22% of twelfth graders reached Proficient math performance, and nearly 45% scored below the Basic level, indicating many students are graduating without key math foundations.
What “Behind Grade-Level” Really Means
It’s worth clarifying that NAEP’s Proficient level is a high bar - it reflects solid academic performance that typically exceeds basic expectations. So even students not deemed “Proficient” may still be on track for grade-level work in some districts. Still, the data below Basic suggests significant struggles with core skills, making this a useful marker for kids who are genuinely behind.
One reason these gaps persist is that many students never develop strong math fact fluency- the ability to recall basic math facts accurately, efficiently, and flexibly - which underpins later success in problem solving and higher-level math.
Trends Over Time: Pandemic & Pre-Pandemic Context
Math performance in the U.S. has shown long-term stagnation - and in some cases decline - that predates the COVID-19 pandemic. The pandemic amplified learning disruptions, accelerated declines for lower-performing students, and widened opportunity gaps. Research on post-COVID learning data finds persistent math learning loss for many students even years after schools reopened.
Synthesis data from CRPE’s State of the American Student 2025 shows that academic recovery is unfolding alongside persistent engagement challenges: large national surveys cited in the report indicate that roughly one in three students remains chronically absent, and many students report lower motivation and confidence in academic work compared to pre-pandemic levels. These conditions help explain why math progress remains slow even as instructional time and schooling routines have largely returned to normal.
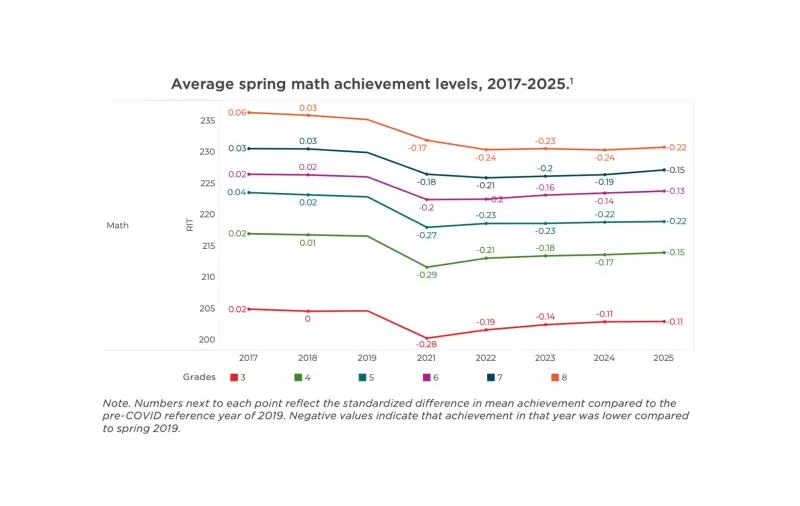
Large datasets like NWEA MAP Growth tests show that math achievement has regained some ground by spring 2025, with achievement gaps generally shrinking each year since spring 2021 - and those patterns come from a national dataset spanning over 10 million K–8 students in 30,000 schools.
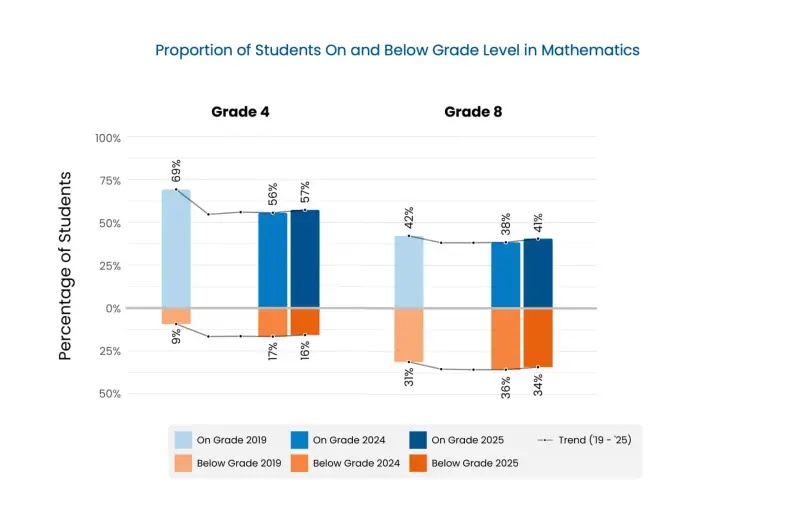
A useful secondary lens (separate from NAEP) comes from the 2025 “State of Student Learning” report based on i-Ready Diagnostic data: it notes the Diagnostic was taken by nearly 14 million students in the 2024–2025 school year, and defines “below grade level” as students placing Two or More Grade Levels Below. In that same report’s trend table for math, about 57% of Grade 4 students were on grade level in math in 2025 (with about 16% placing two or more grade levels below), and about 41% of Grade 8 students were on grade level in math in 2025 (with about 34% placing two or more grade levels below). These figures aren’t a replacement for NAEP, but they’re helpful for showing how “behind grade level” looks in a very large, skills-based assessment dataset.
Zooming out to district-level recovery, the Education Recovery Scorecard concludes that as of spring 2024, the average U.S. student was still nearly half a grade level behind in math compared to pre-pandemic performance, with inequality baked into the recovery: highest-income decile districts were nearly 4x more likely to recover than the lowest-income decile districts (14.1% vs. 3.9%). The same report also notes that chronic absenteeism played a significant role in slowing recovery, and that federal relief dollars reduced losses by 10% of a grade equivalent in math and reading in higher-poverty districts (with results depending on how funds were spent).
If you want a “federal summary” source that points readers to the latest national achievement indicators, NCES also publishes annual highlights in the Condition of Education; see Learn About the New Condition of Education 2025: Part I.
Disparities by Race, Income & Other Factors
The national averages mask deep disparities rooted in opportunity and access. The 2025 math research summary from the National Council on Teacher Quality shows that students in high-poverty schools and historically underserved communities are significantly less likely to receive consistent access to grade-level math instruction, experienced teachers, and high-quality instructional materials. These systemic differences in instructional access shape students’ opportunities to learn long before test scores are reported.
These opportunity gaps contribute directly to the achievement patterns seen in national data: when students are more frequently taught below grade level or by less well-prepared teachers, they are more likely to struggle with foundational math skills and to perform below basic benchmarks. As a result, students with fewer instructional resources are disproportionately represented among those classified as “behind grade level” in math, reflecting inequities in access rather than differences in ability
What This Means for Families & Schools
If nearly two-thirds of middle schoolers aren’t reaching Proficient levels and many high school seniors are leaving school without strong math foundations, it means more work needs to be done. The data consistently points to the same set of needs: earlier identification of gaps, more time spent on foundational concepts, and instructional approaches that make math understandable rather than overwhelming.
- For families, this means looking beyond grades to whether children truly understand number sense, operations, and problem-solving strategies.
- For schools, it means prioritizing access to grade-level instruction, supporting teachers with high-quality materials, and using formative data to intervene before gaps widen.
When math instruction is designed around how students actually learn - with clear models, practice that builds confidence, and support for diverse learners - the numbers can change.
References
- NAEP 2024 Mathematics (Grades 4 & 8): The Nation’s Report Card
- NAEP 2024 Mathematics (Grade 12): The Nation’s Report Card
- Secondary assessment-based report (i-Ready Diagnostic, July 2025): State of Student Learning in 2025 (PDF)
- NWEA research brief (MAP Growth, Spring 2025): Trend Snapshots: Math recovery continues, reading remains stalled in spring 2025 (PDF)
- Education Recovery Scorecard (district-level recovery, Feb 2025): ERS 2025 National Press Release (PDF) and Education Recovery Scorecard site
- NCES federal highlights (Condition of Education, 2025): Learn About the New Condition of Education 2025: Part I
- CRPE synthesis report (2025): State of the American Student 2025 (PDF)