7 Visual Organizers That Simplify Multi-Step Math Problems
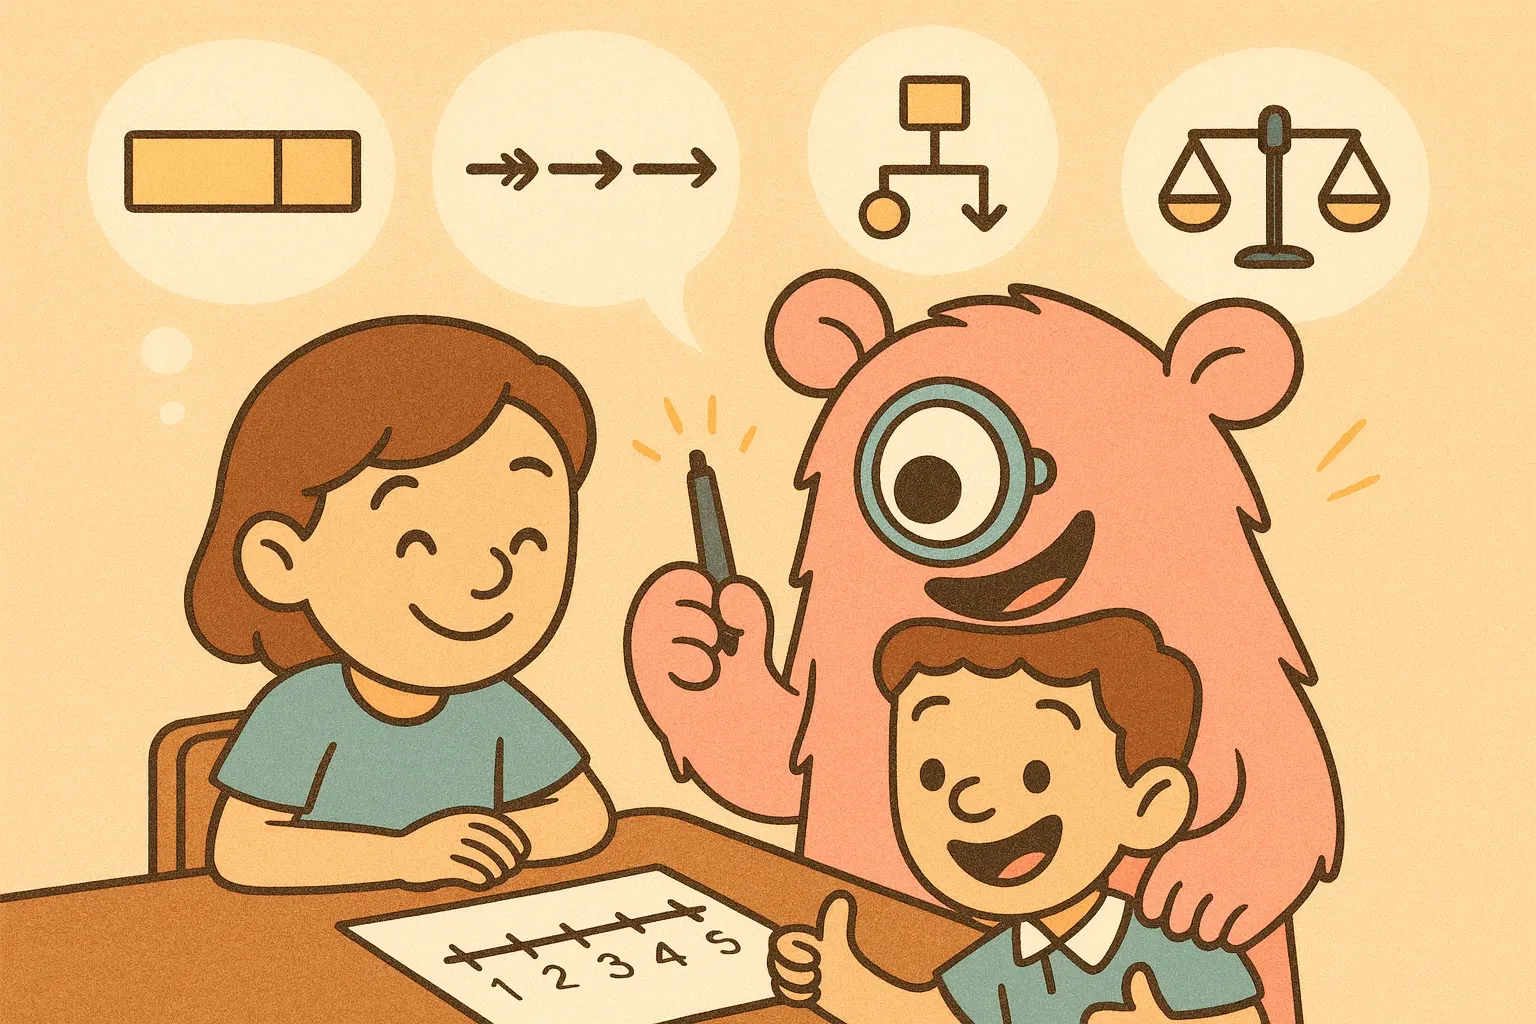
TL;DR:When kids face multi-step word problems, a picture or chart can act like a GPS. Tools such as sketches, bar models, number lines, flowcharts, tables, balance models, and step-by-step mats reduce mental juggling and make the structure of a problem visible. Students who create accurate visual-schematic representations are far more likely to solve word problems correctly, with one study reporting nearly a six-fold increase in success.
Multi-step problems are often tough not because of the math, but because kids must hold many details and steps in mind; visual supports offload that working-memory load and help students reason about relationships instead of guessing operations. Below are seven organizers you can use at home or in class - each with quick “how to” notes and research to back them up.
1) “Sketch the Story” (Quick Situation Drawings)
Use when: A word problem is dense or kids aren’t sure what the story means.
How: Ask students to draw simple icons for quantities (dots, tally marks, stick figures), label known numbers, and show each step in order. The goal isn’t art; it’s clarity.
Why it works: Converting text into a picture forces deeper comprehension and reduces cognitive load. Item-level analysis shows that students who produced an accurate visual-schematic representation were almost six times likelier to solve correctly. For learners who need explicit routines, schema-based approaches that teach “read → represent → compute → check” improve accuracy and maintenance over time. As a bonus, it turns problem-solving into a more engaging, active process (almost like storytelling) rather than a passive reading exercise.
2) Bar Models (Strip/Tape Diagrams)
Use when: The problem involves part-whole, comparison, or multi-step totals (including fractions and ratios).
How: Draw a long “whole” bar and partition into known parts; mark the unknown with a “?”. Keep relative bar lengths proportional to quantities.
Why it works: Bar models expose structure - what is the whole, which parts are known, and what is missing - so operation choice becomes obvious. Classroom studies report significant gains on multi-step word problems after brief instruction in the model method, and teacher action research notes better interpretation of fraction and money problems when students diagram with bars.
3) Number Lines (Keep Track of Multi-Step Changes)
Use when: The problem is a sequence of increases/decreases (money, temperature, elapsed time) or involves integers, fractions, or proportional jumps.
How: Place the starting value, then draw “hops” for each step (left for subtract, right for add; equal-sized hops for repeated steps). Label the final position. For a no-prep version that does the hops for you, try the free Number Line Jumps Visualizer - which auto-decomposes any number into 10s, 5s, and 1s so students can see efficient paths.
Why it works: Number lines turn operations into visible movement and strengthen magnitude sense. Randomized and quasi-experimental work shows that linear number-line and board-game experiences produce broad, stable improvements in numerical knowledge that generalize to tasks like number-line estimation and arithmetic, and a meta-analysis links number-line skill to broader math competence across studies.
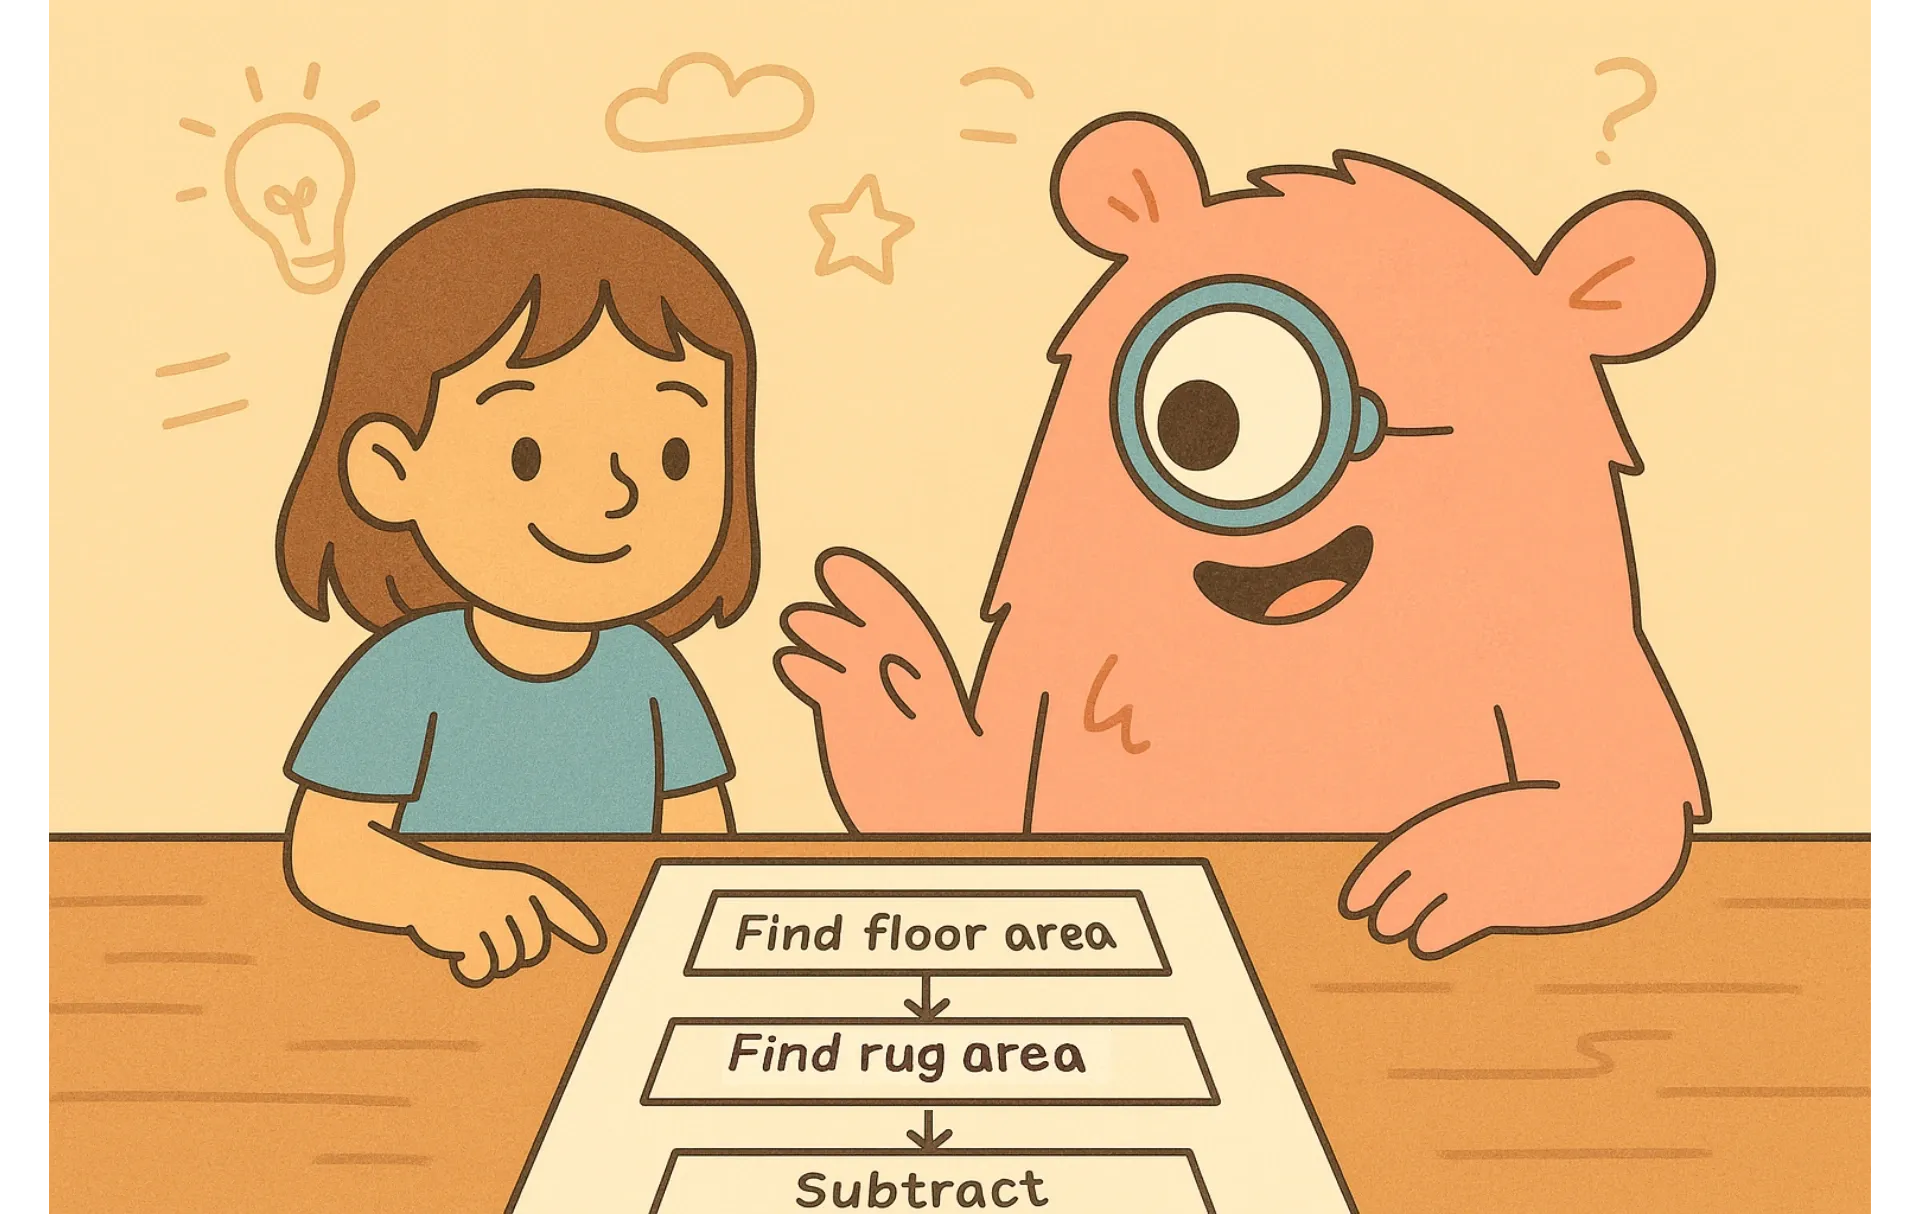
4) Flowcharts (A Visual Plan Before Computing)
Use when: Students lose their place or the next step depends on a decision (e.g., “if the remainder is… then…”).
How: Write each action in a box (“Find area of floor” → “Find area of rug” → “Subtract”); use diamonds for yes/no checks (“Is side length known?”).
Why it works: Flowcharts externalize executive-function steps so students can follow a plan instead of juggling it mentally. In classrooms where teachers explicitly teach schematic/stepwise approaches with visual supports, word-problem accuracy improves for both general-education and struggling learners.
5) T-Charts & Tables (Organize Data and Repeated Steps)
Use when: The problem lists several values, evolves over weeks/steps, or hides a pattern (rates, sequences, conversions, multi-case logic).
How: Create columns for what’s given and what’s needed (e.g., “Week,” “Saved this week,” “Total saved”); fill row by row.
Why it works: Tabular organization reduces errors from misplaced or forgotten values and helps students spot regularity (e.g., “+3 each week”). Studies comparing structured, representation-rich instruction to generic strategies report stronger word-problem outcomes when students learn to map problem elements into consistent visual formats like tables alongside diagrams.
6) Balance Models (Visual Equations & Algebra Tiles)
Use when: Students get stuck translating a story into an equation or solving multi-step linear equations.
How: Represent both sides of an equation as a scale (or with tiles): remove or add equal “weights” on each side to keep it balanced while isolating the unknown.
Why it works: Balance visuals connect the abstract “do the same to both sides” to a concrete principle of equality. A recent study with students using virtual manipulatives found that virtual algebra tiles improved equation-solving performance compared with traditional methods. For many middle-schoolers, tiles and scales become a bridge from story to model to algebra.
7) Problem-Solving Mats & Checklists (Visual Metacognition)
Use when: Students rush, skip planning, or forget to check reasonableness.
How: Give a one-page organizer with boxes such as “What’s the question?”, “What do I know?”, “Plan/strategy,” “Work,” “Answer & check.” Students fill it as they go.
Why it works: These mats scaffold the cognitive routine of expert problem solvers. Across multiple studies, schema-based instruction -which pairs explicit step sequences with schematic diagrams -improves word-problem accuracy and transfer for students with and without learning difficulties.
Quick Tips: Make Visuals a Habit (Home + Classroom)
Start with structure, not computation. Read once for the story, then immediately draw or chart before calculating; this mirrors the research-supported “represent → compute → check” flow.
Scale difficulty by grade. In elementary, lean on sketches, bars, number lines; in middle school, add flowcharts, tables, and balance models.
Use the same organizer across topics. The bar model that clarifies part-whole today will clarify ratios next month.
Normalize visuals. Let kids see you sketch too; experts sketch! Consistent modeling increases adoption.
In the end, the goal isn’t to make math fancier - it’s to make thinking visible. Whether you’re a parent at the kitchen table or a teacher guiding a whole class, these seven visual organizers help kids offload working memory, see relationships, and move through multi-step problems with fewer wrong turns. With a couple of these tools in their toolkit, kids won’t just solve more problems; they’ll feel more confident doing it.
FAQs
1) Which organizer should I try first?
Match the tool to the barrier: if the story is confusing, start with a quick sketch or bar model; if it’s the sequence that gets lost, build a flowchart or number-line plan; if there’s lots of data, make a table.
2) My student says drawing “takes too long.”
Try a 60-second sketch challenge. Students often discover that one minute of planning prevents five minutes of backtracking - an effect reflected in studies where accurate representations strongly predict correct solutions.
3) Do these strategies help strong math students too?
Yes - visuals don’t just “rescue”; they deepen reasoning and transfer (e.g., number-line magnitude knowledge relates to broader achievement per meta-analysis), and schematic approaches help advanced learners explain and generalize.
References:
Boonen, A. J. H., van Wesel, F., Jolles, J., & van der Schoot, M. (2014). The role of visual representation type, spatial ability, and reading comprehension in word-problem solving. International Journal of Educational Research, 68, 15–26. Link
Griffin, C. C., & Jitendra, A. K. (2009). Word problem-solving instruction in inclusive third-grade mathematics classrooms. The Journal of Educational Research, 102(3), 187–202. Link
Jitendra, A. K., DiPipi, C. M., & Perron-Jones, N. (1996). Effects of schema-based instruction on the mathematical word-problem-solving performance of students with learning disabilities. Journal of Learning Disabilities. Link
Bao, L. (2016). The effectiveness of using the model method to solve word problems. Australian Primary Mathematics Classroom, 21(3), 25–32. Open PDF
Spencer, R. (2015). Using the Singapore Bar Model to support the interpretation of word problems. Proceedings of the British Society for Research into Learning Mathematics. Open PDF
Ramani, G. B., & Siegler, R. S. (2008). Promoting broad and stable improvements in low-income children’s numerical knowledge through playing number board games. Child Development. Open PDF
Siegler, R. S., & Ramani, G. B. (2009). Playing linear number board games improves children’s numerical understanding. Child Development Perspectives. Link
Schneider, M., Merz, S., Stricker, J., De Smedt, B., Torbeyns, J., Verschaffel, L., & Luwel, K. (2018). Associations of number-line estimation with mathematical competence: A meta-analysis. Child Development. Open PDF
Powell, S. R. (2018). Effective word-problem instruction: Using schemas to facilitate mathematical reasoning. Intervention in School and Clinic, 54(3), 131–140. Open Access

Comments
Your comment has been submitted